Stability
Setup stability
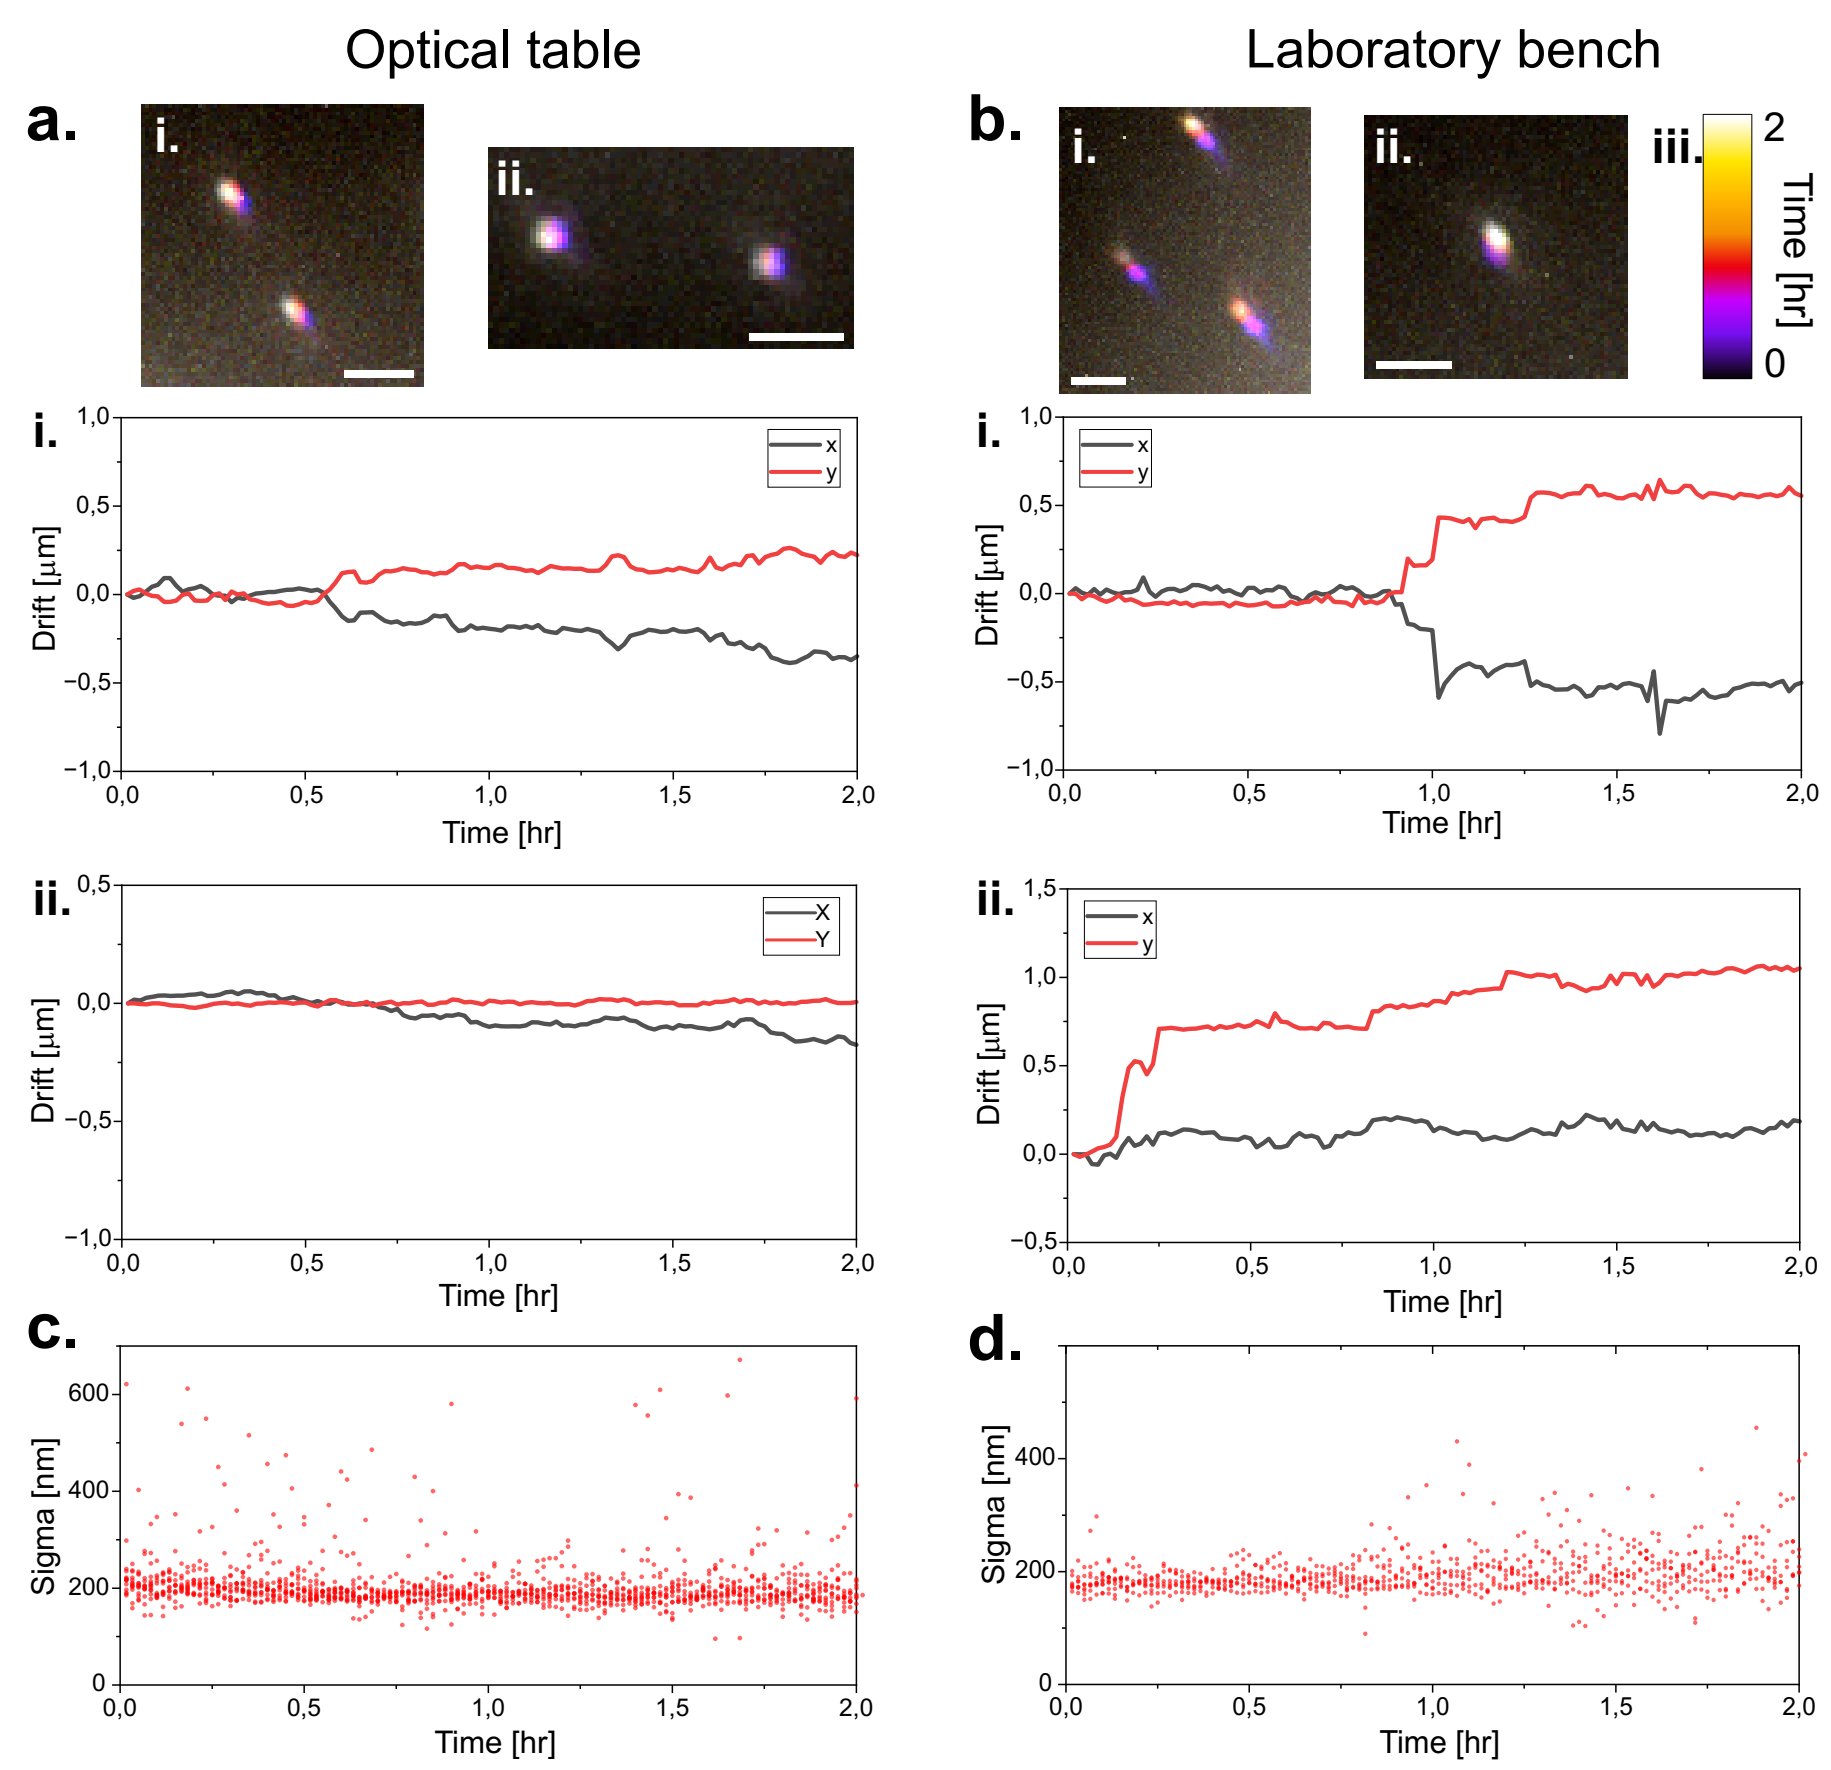
Measurement of the drift of fluorescent TS beads on the UC2 setup with 60x objective over a duration of two hours positioned upon a. an optical table b. a common laboratory bench. Bead positions are estimated through localization and displacement in i. and ii. are plotted in the graphs below. c. (for the optical table i.) and d. (for the laboratory bench i.) show the variation in the sigma value of the localized beads over the measurement duration. The sigma value correlates with the defocusing of the beads i.e. low changes in sigma suggest small fluctuations of the samples axial position.