Setting up the laser
Laser illumination
Illuminating the sample can be done with different lasers. In the here presented setup, the laser illumination is provided by the 638nm Red Laser Module 500mW Round Dot Focusable TTL 3050 (acquired on lasernets.com). In order to perform imaging assays needing high laser intensities, the laser path remains unchanged (see excitation pathway figure) to maximize the photon density at the sample plane. The optional beam magnifier combined with a diffuser enables to have a more even and homogenized illumination across the field of view, which is more desirable for imaging assays with lower requirements in terms of laser density.
The construction consists of a telescopic lens arrangement with a diffusor rotating in the focal point of both lenses. A simplified version can be built by combining a fan, where the rotor blades have been removed, with a piece of cling foil as diffusing material.
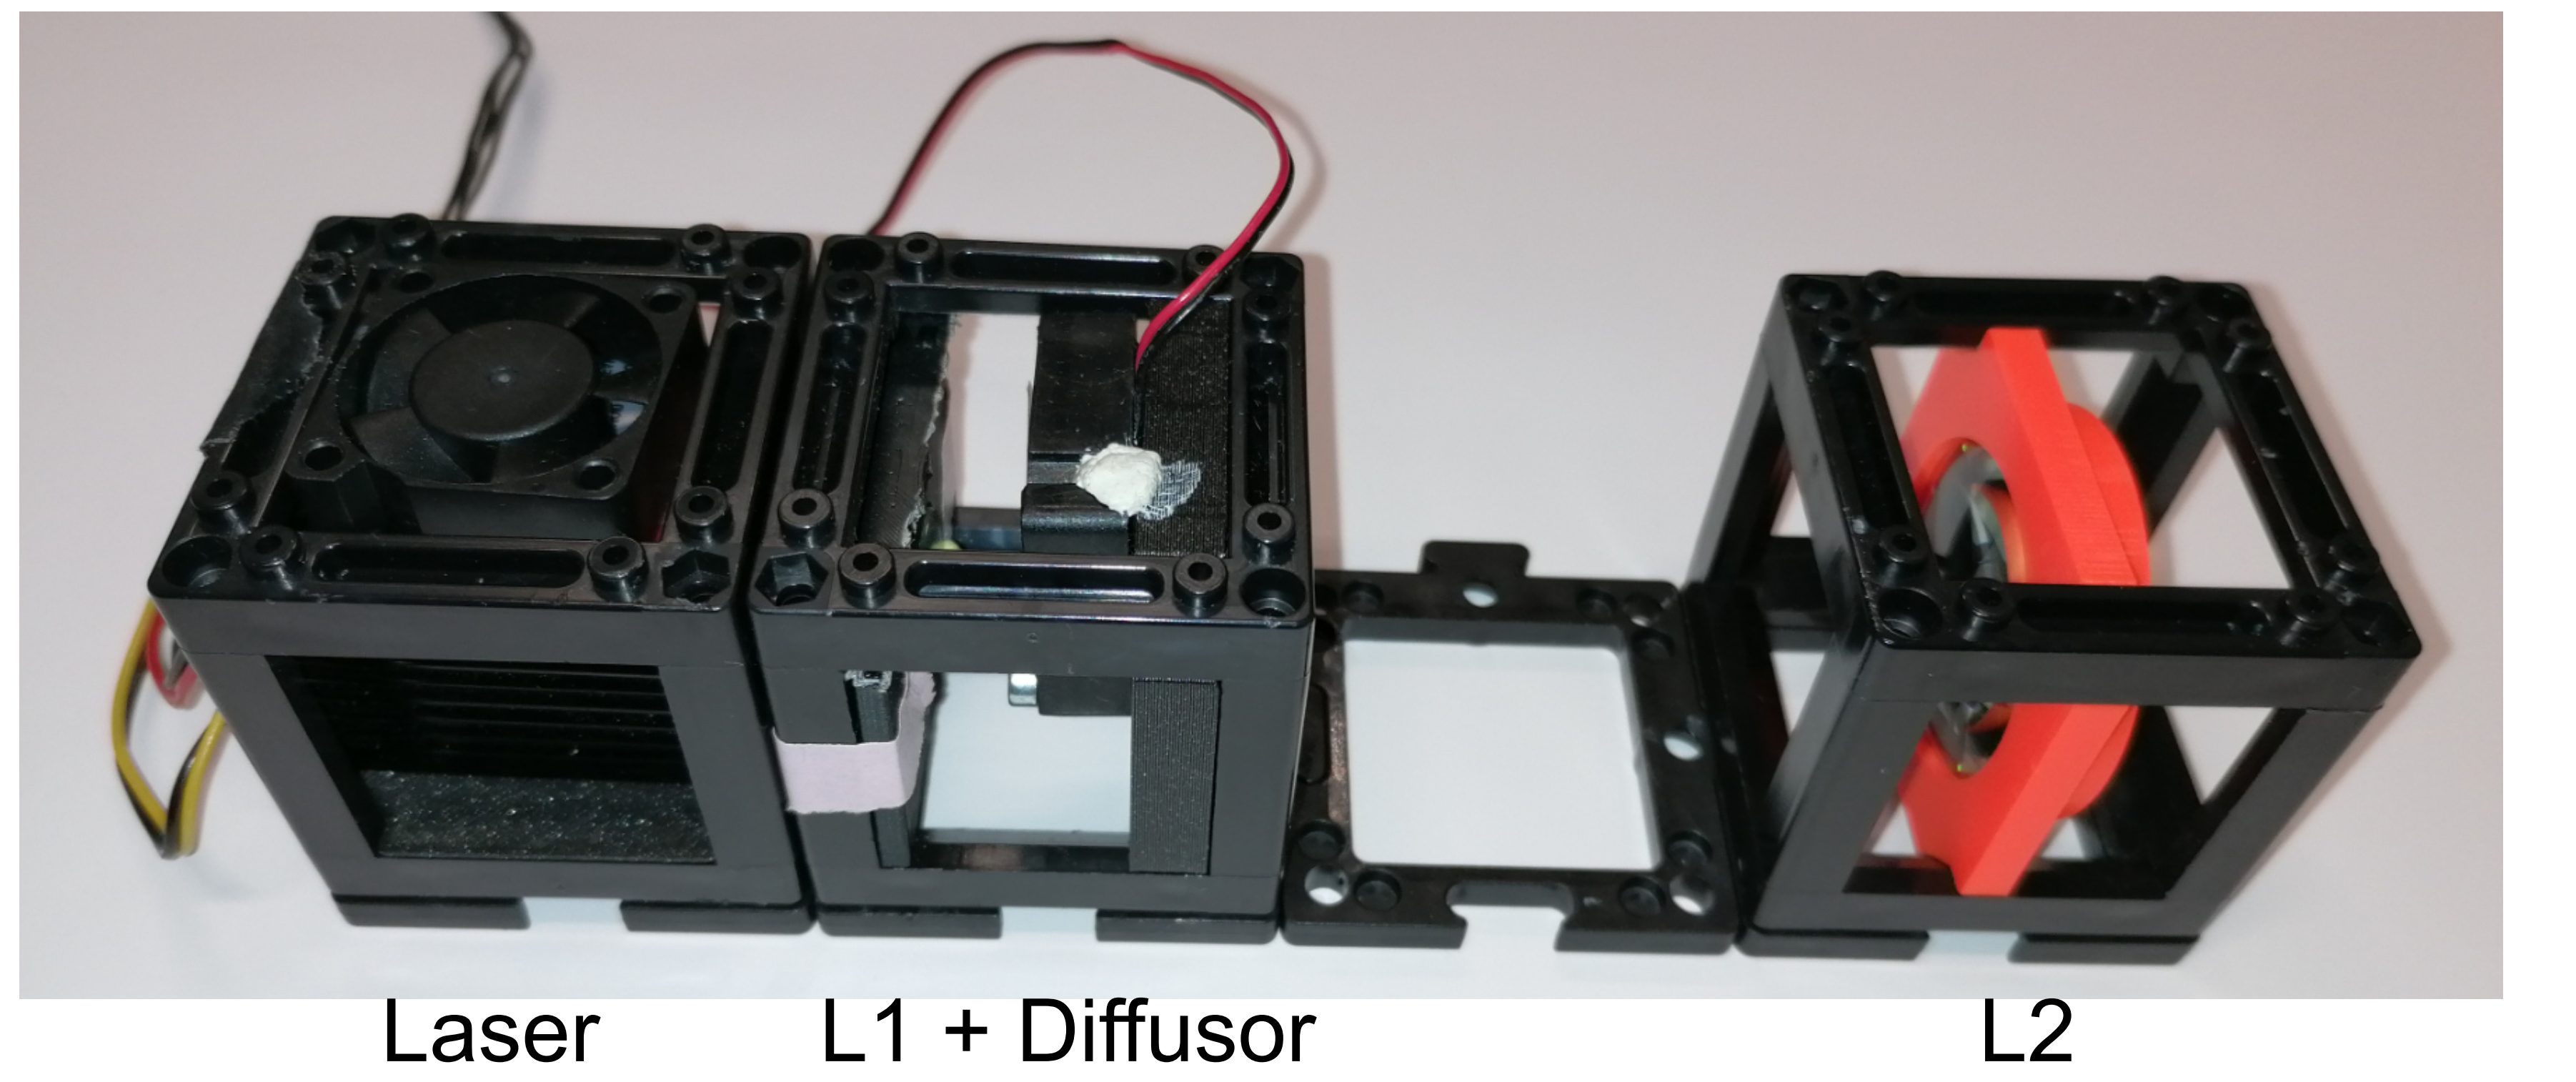 Fig. 1: telescope build with diffuser (rotating cling foil)
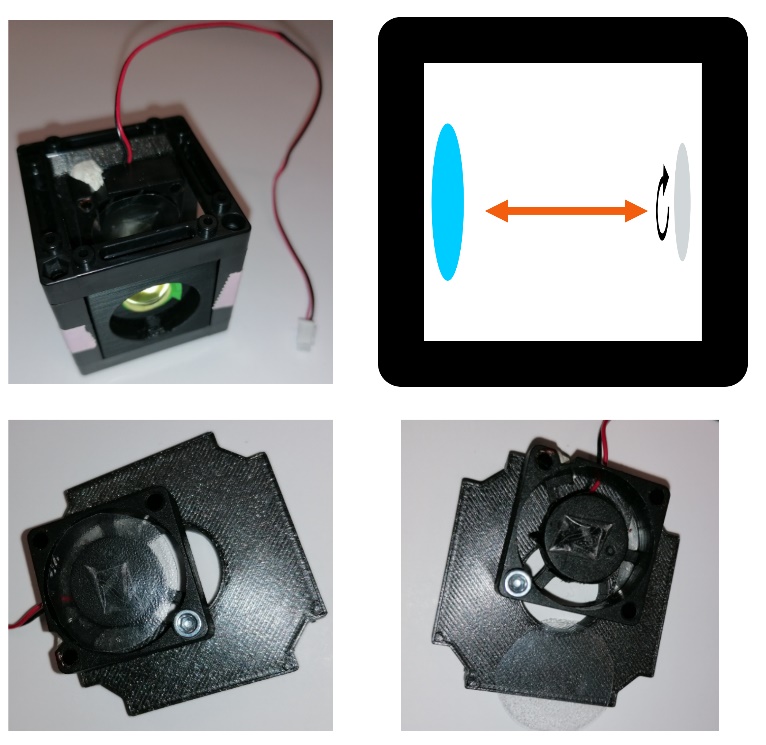 Fig. 2: Within the cube containing L1 and the diffusor, the distance between
both matches the focal length of L1. For different magnification, they
can also be placed within two different cubes. The diffusor itself is
attached to a regular UC2 cube mount. The position of the fan is not
important, as long as the light path is not blocked. The cling foil is
simply stuck to the fan center with a piece of tape.
Fig. 2: Within the cube containing L1 and the diffusor, the distance between
both matches the focal length of L1. For different magnification, they
can also be placed within two different cubes. The diffusor itself is
attached to a regular UC2 cube mount. The position of the fan is not
important, as long as the light path is not blocked. The cling foil is
simply stuck to the fan center with a piece of tape.
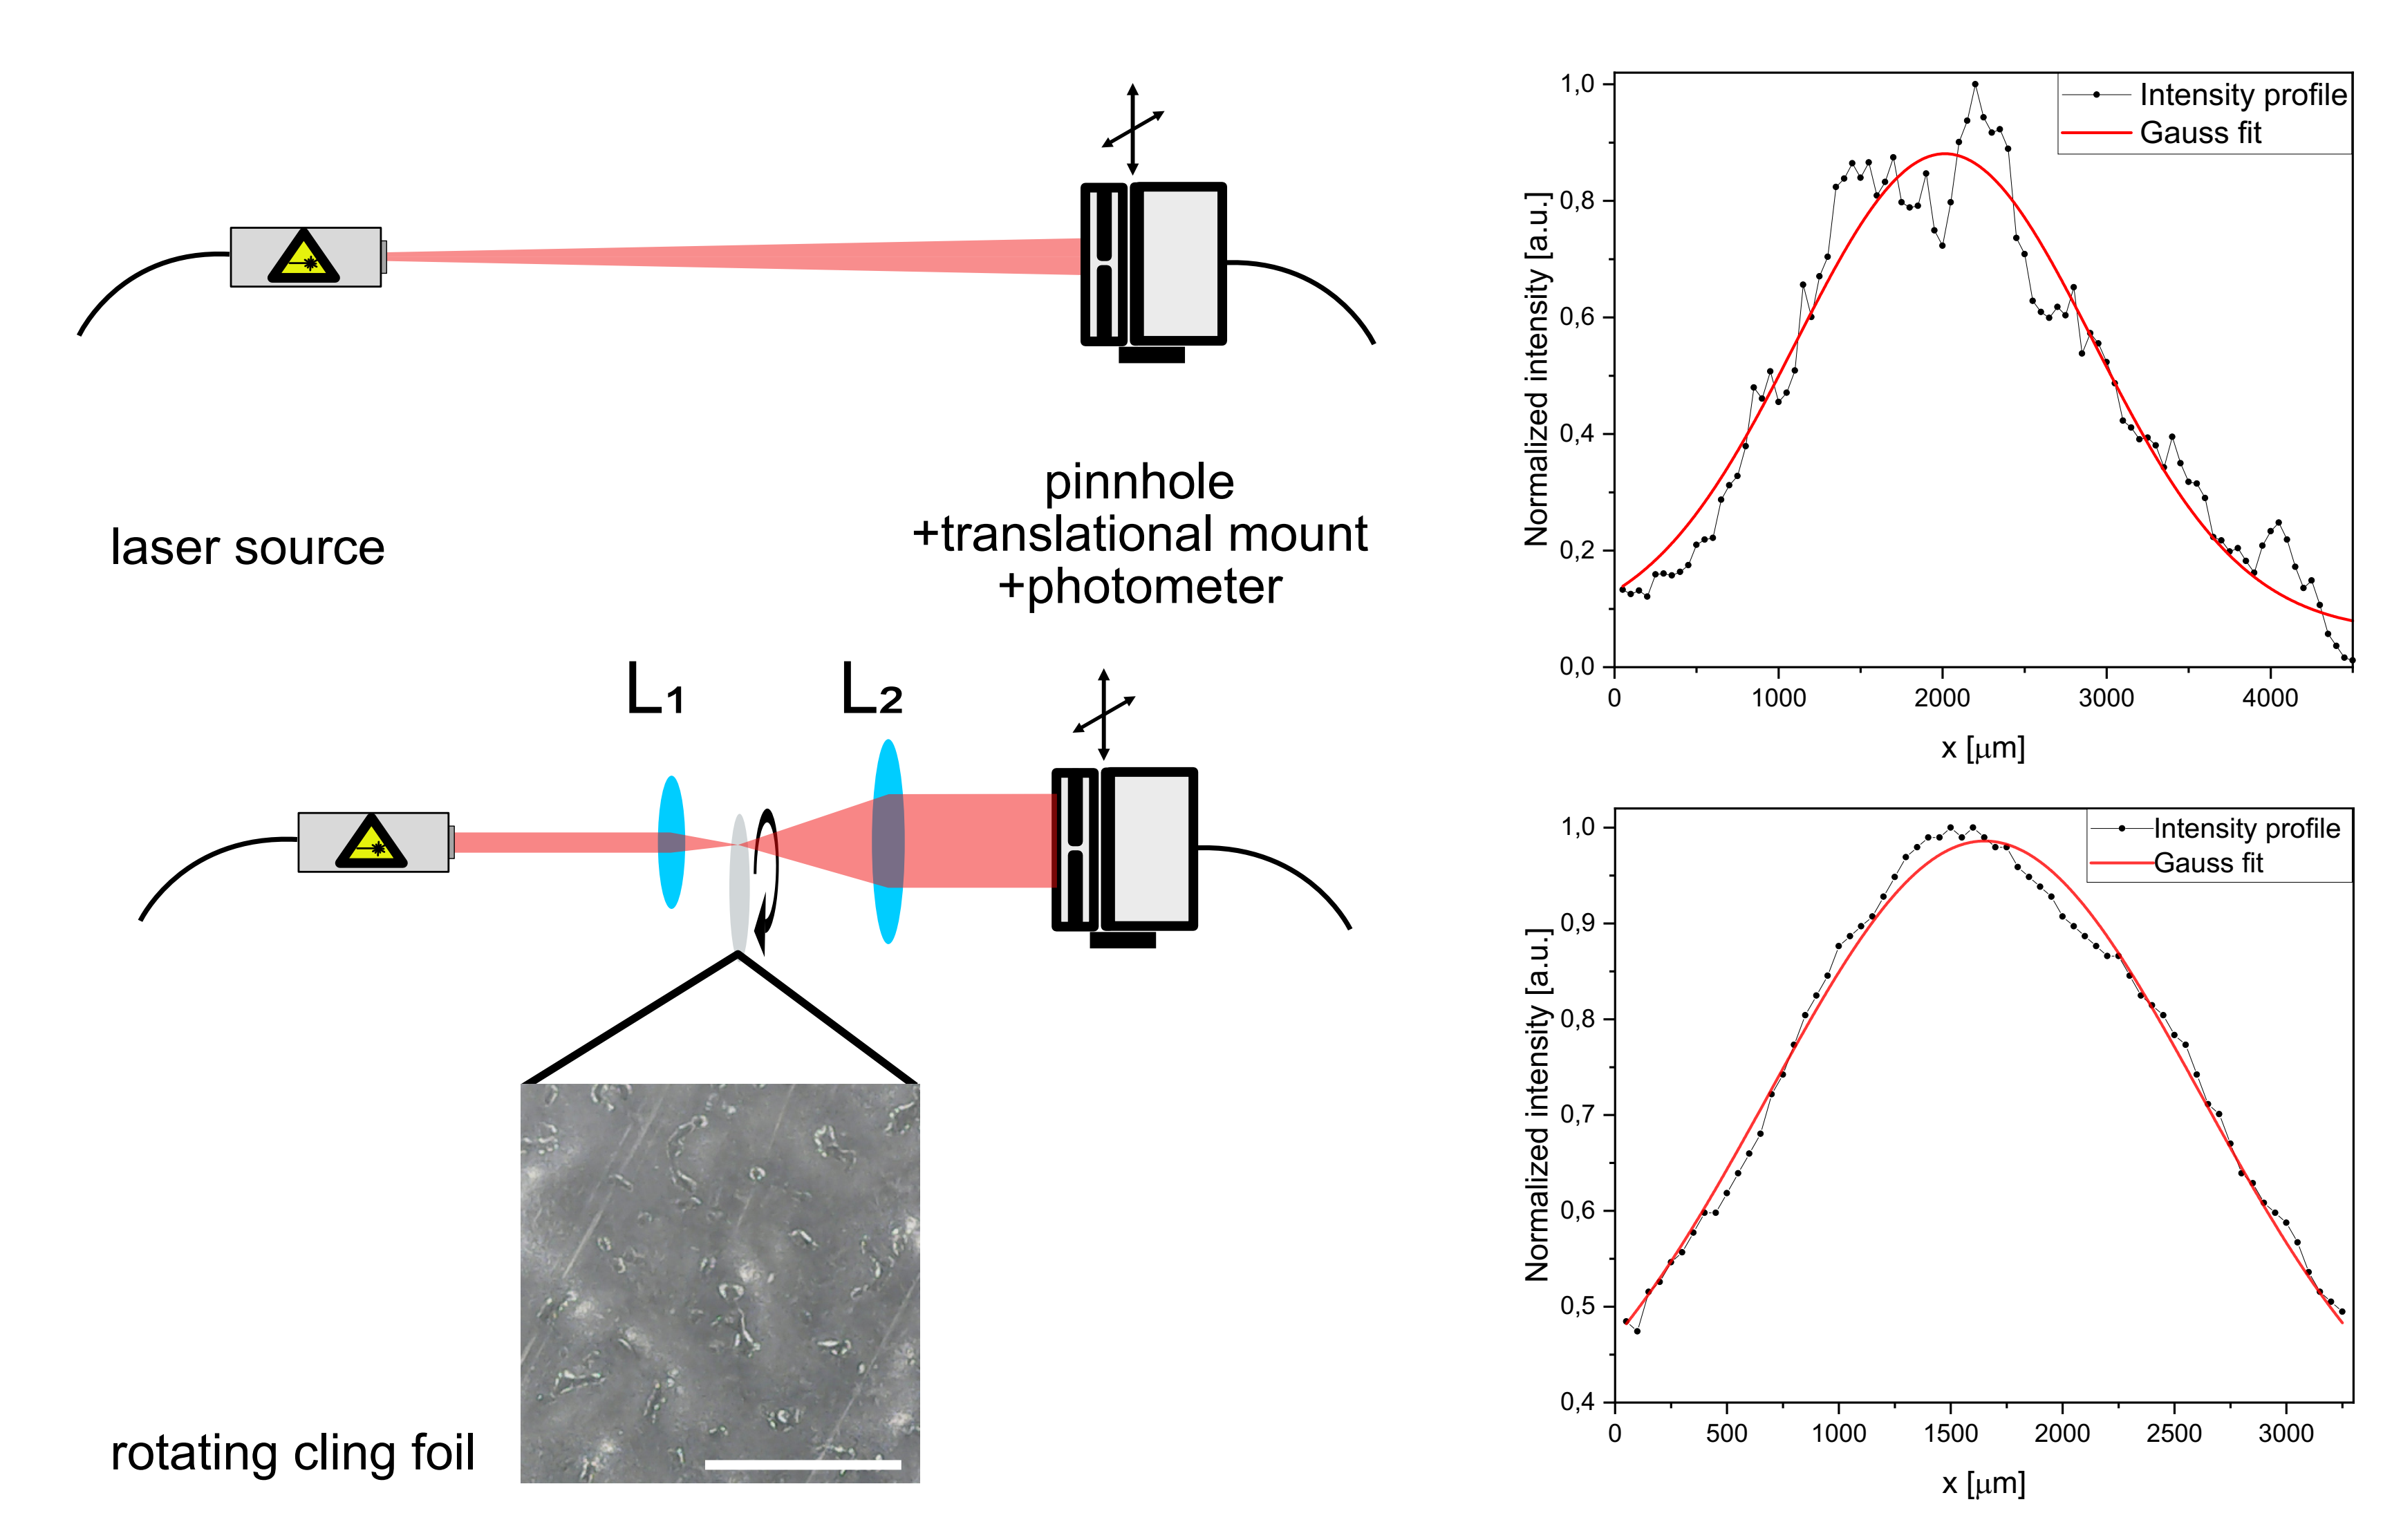
Fig. 3: Difference in laser profile using the diffusor and telescopic lens. The profile has been measured by shifting a photometer covered by a pinhole across the laser spot. The distances between the components on the schematics (left) are not up to scale. The scale bar in the image showing the cling foil surface represent 1mm.
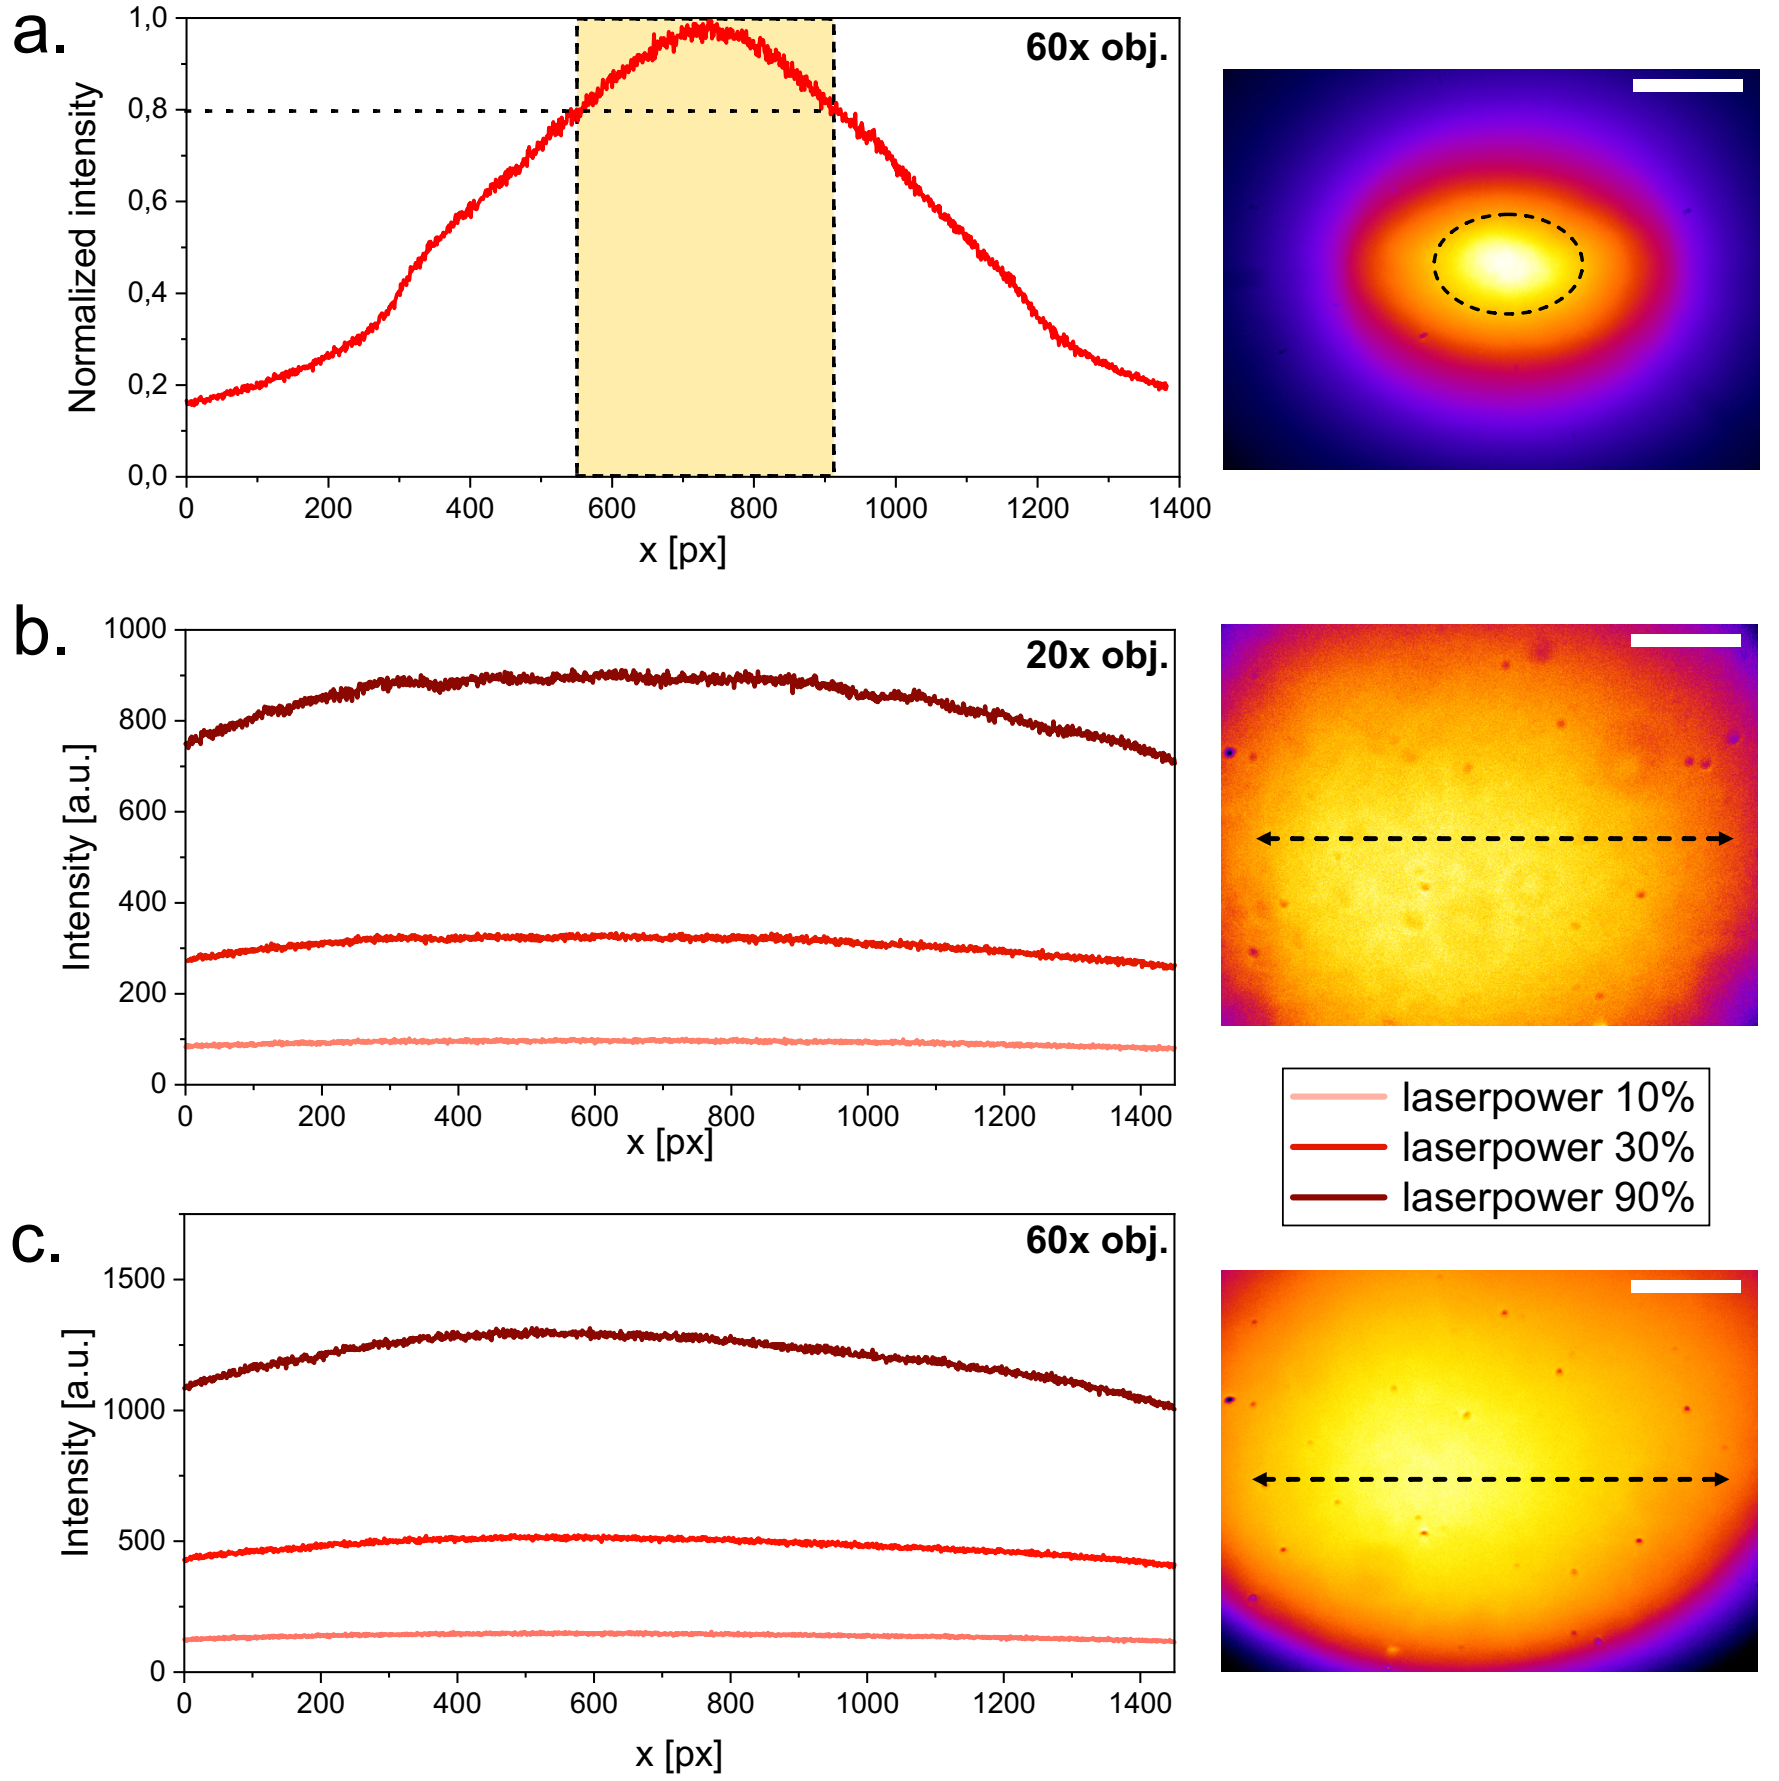
Fig. 4: Illumination profile as measured on a fluorescent far red Chroma slide at the sample plane. Illumination of the laser itself using a 60x objective (a.), of the laser combined with diffusor, telescope and a 20x objective (b.), of the laser combined with diffusor, telescope and a 60x objective (c.). The graphs on the left represent the horizontal profile of the illumination. The images on the right represent the complete field of view, with scale bars representing 30 µm for the 60x and 90 µm for the 20x objective.
Filtering Illumination
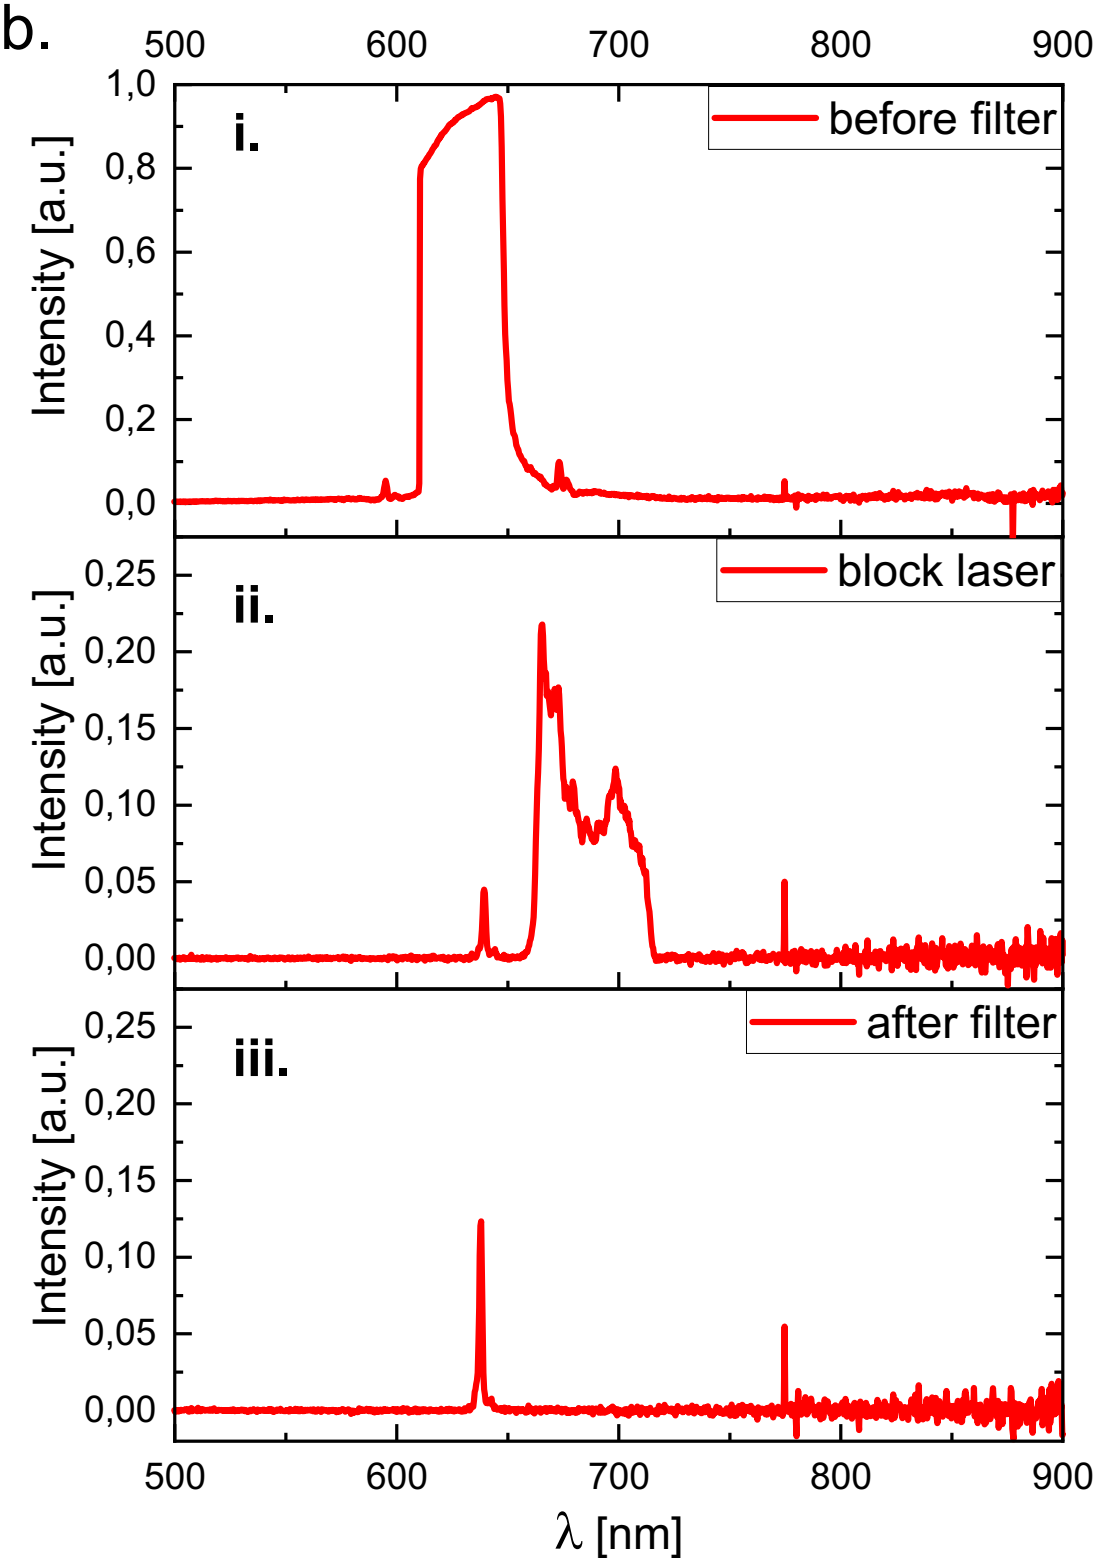
Spectrum of the laser emission measured at the sample plane i. without any filter, ii. with a filter only blocking the laser-line, iii. with a combination of emission filter and excitation filter.
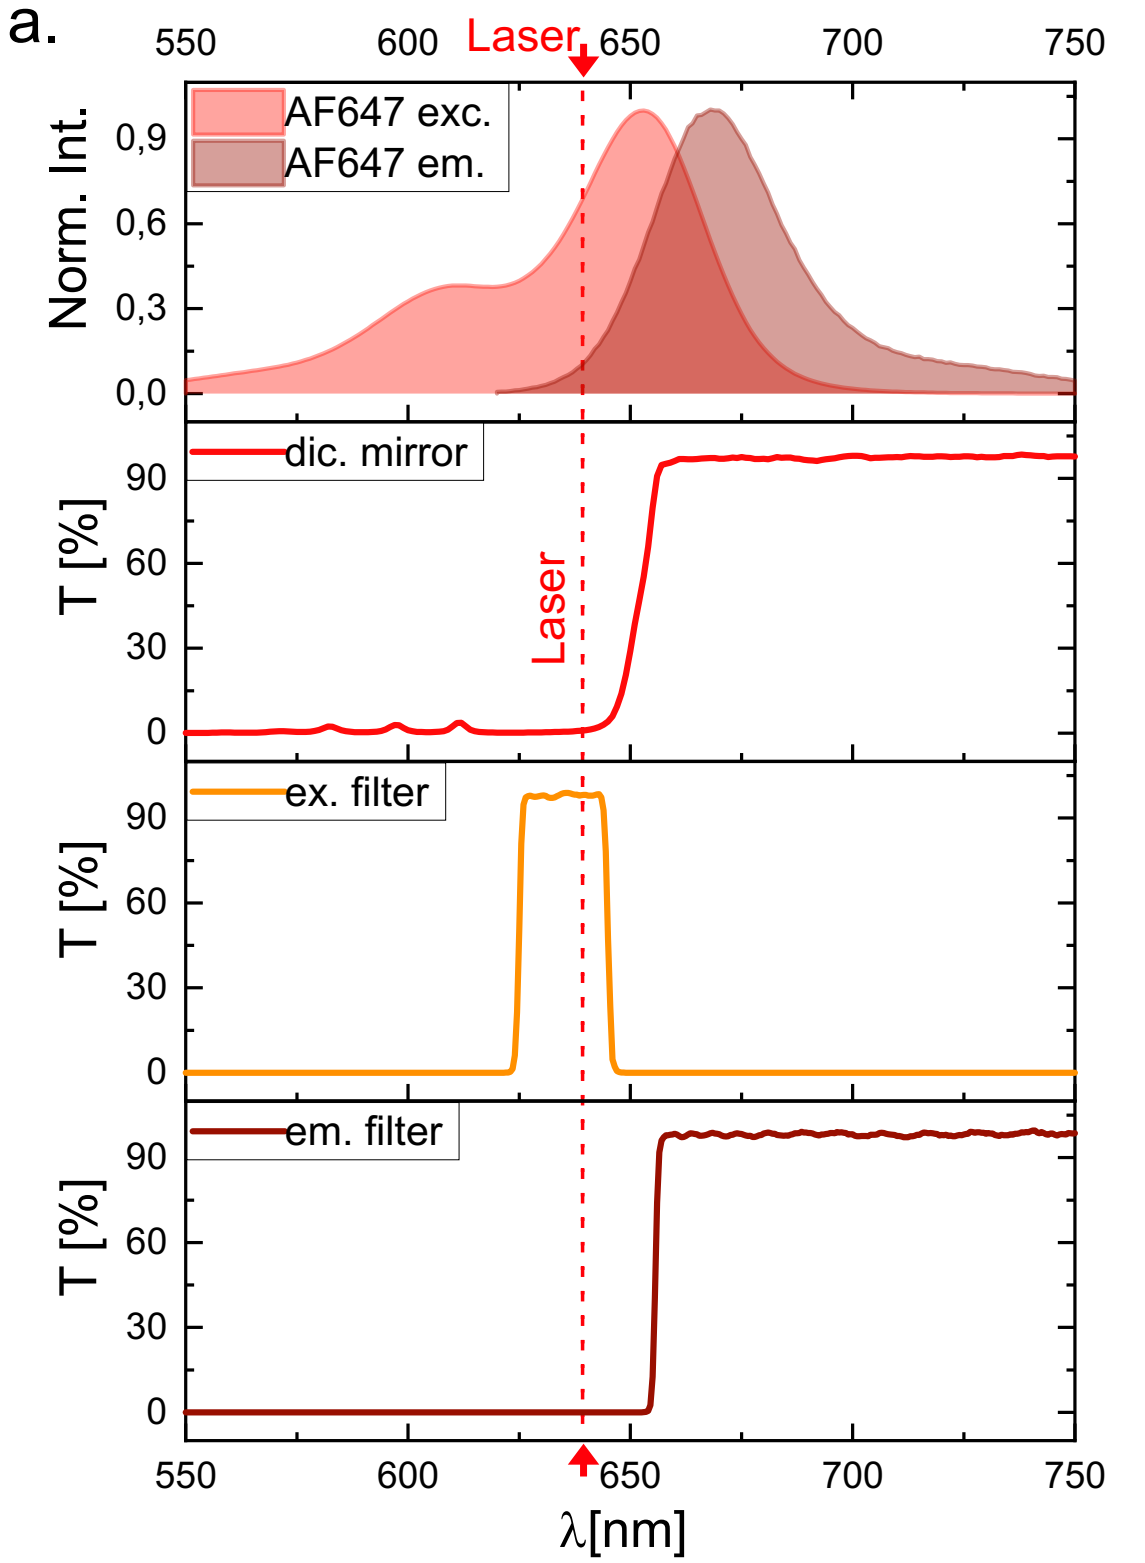
Absorption and emission spectrum of AF647, spectra of the dichroic mirror (Chroma ZT640rdc), the excitation filter (Chroma ZET635/20x EX), and the emission filter (for λ > 655 nm, Chroma ET655lp long-pass).
Illumination with a fiber coupled laser
The usage of a simple laser which can be adapted according to the experimental needs is a solution which makes the setup adaptable and allows users to perform different assays without acquiring additional hardware. For microscopy applications where high laser intensities applications are not necessary, the use of a fiber coupled laser might be a practicable alternative for the illumination. Laser beams emanating from a single mode fiber have a gaussian profile which should be free of speckles and interferences. The fiber also has advantages in terms of laser safety and simplicity of usage as it can be combined to various commercially available cage and tube systems.
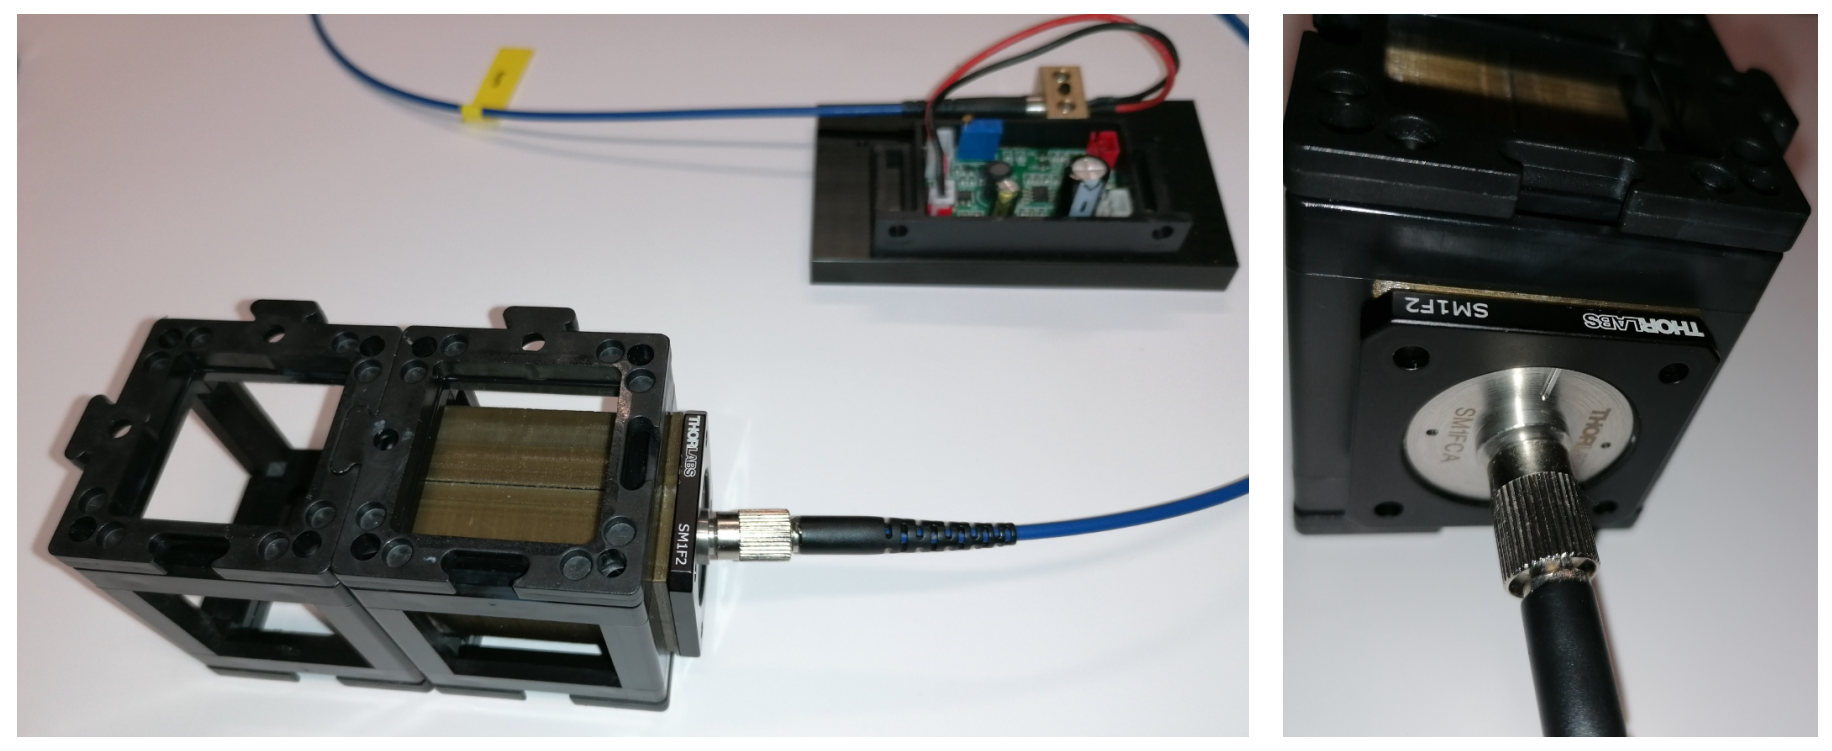
Fig. 5: Fiber illumination module.
. The lens (b) is connected to the fiber adapter (d) via a tube with mounting threads (c). Length of the tube is adapted to set the distance between the lens and the fiber end (e) to the focal length of the lens (b, here 50 mm).
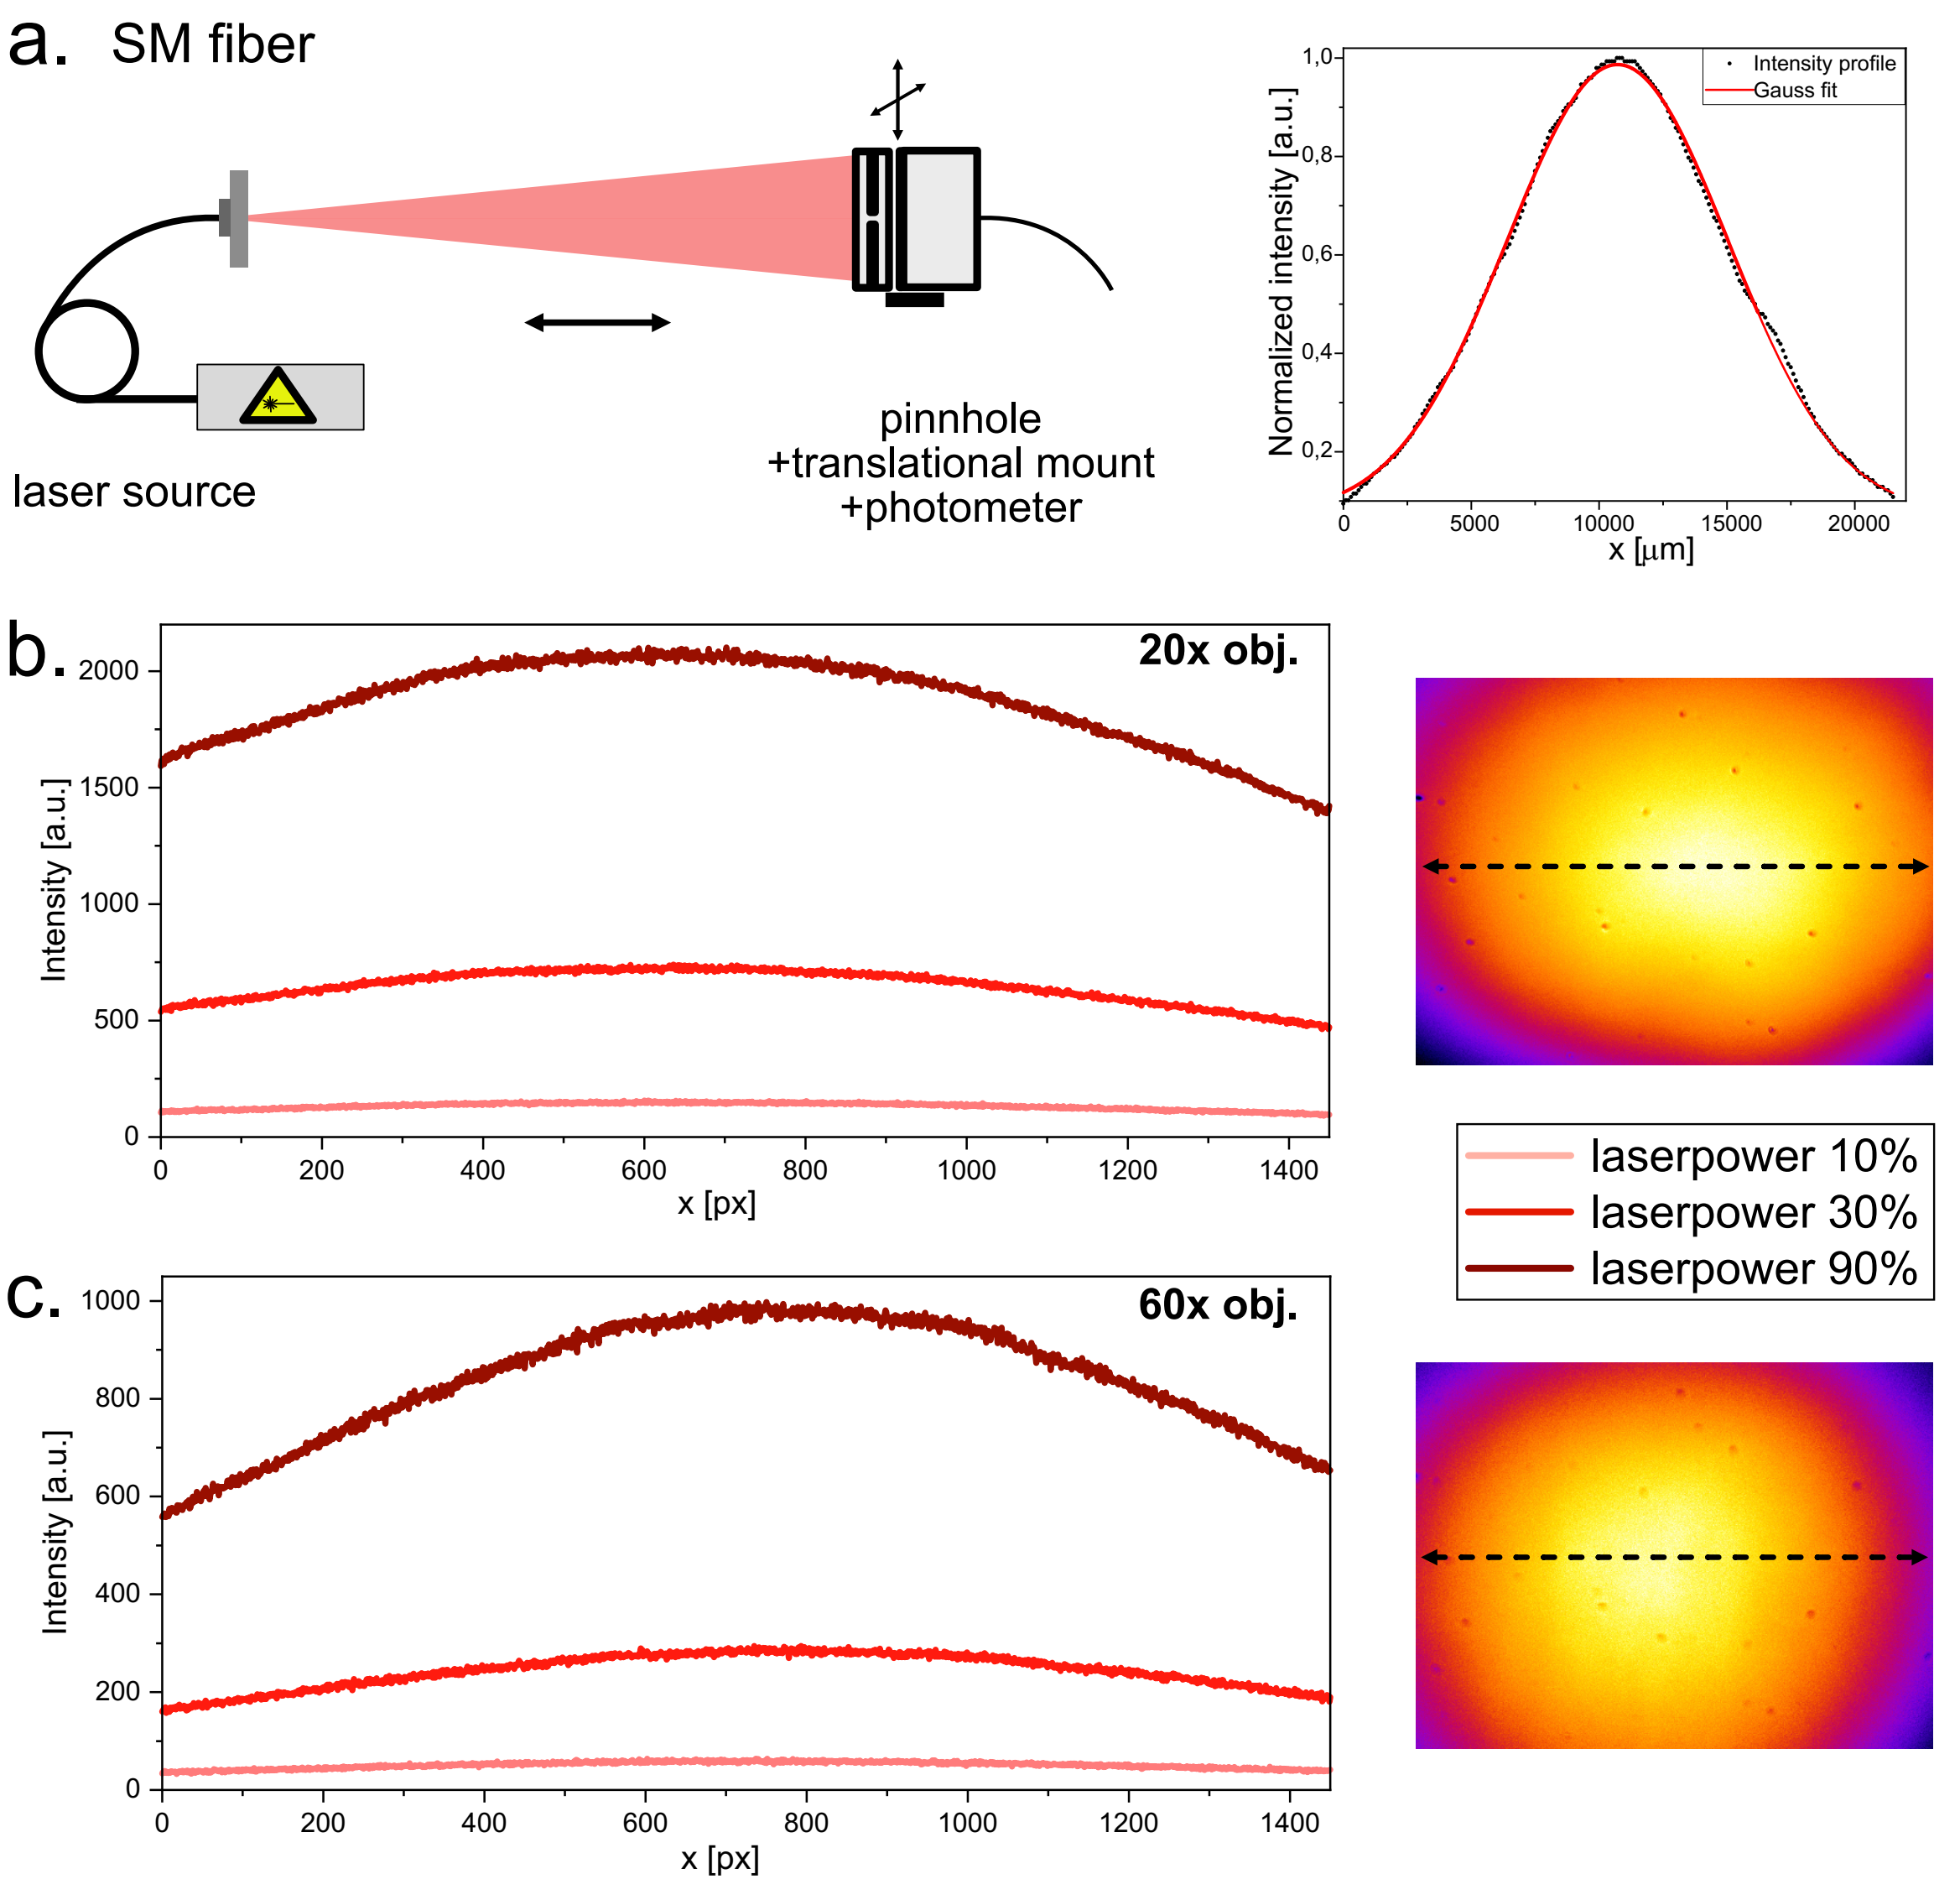
Fig.7: Characterization of the fiber laser illumination. a. Laser profile measured by shifting a photometer covered by a pinhole across the laser spot. The illumination is further characterized by imaging a far-red fluorescent Chroma slide with a 20x and a 60x objective. The horizontal line profiles (left) represent the dotted line on the images of the field of view (right).
Top light illumination
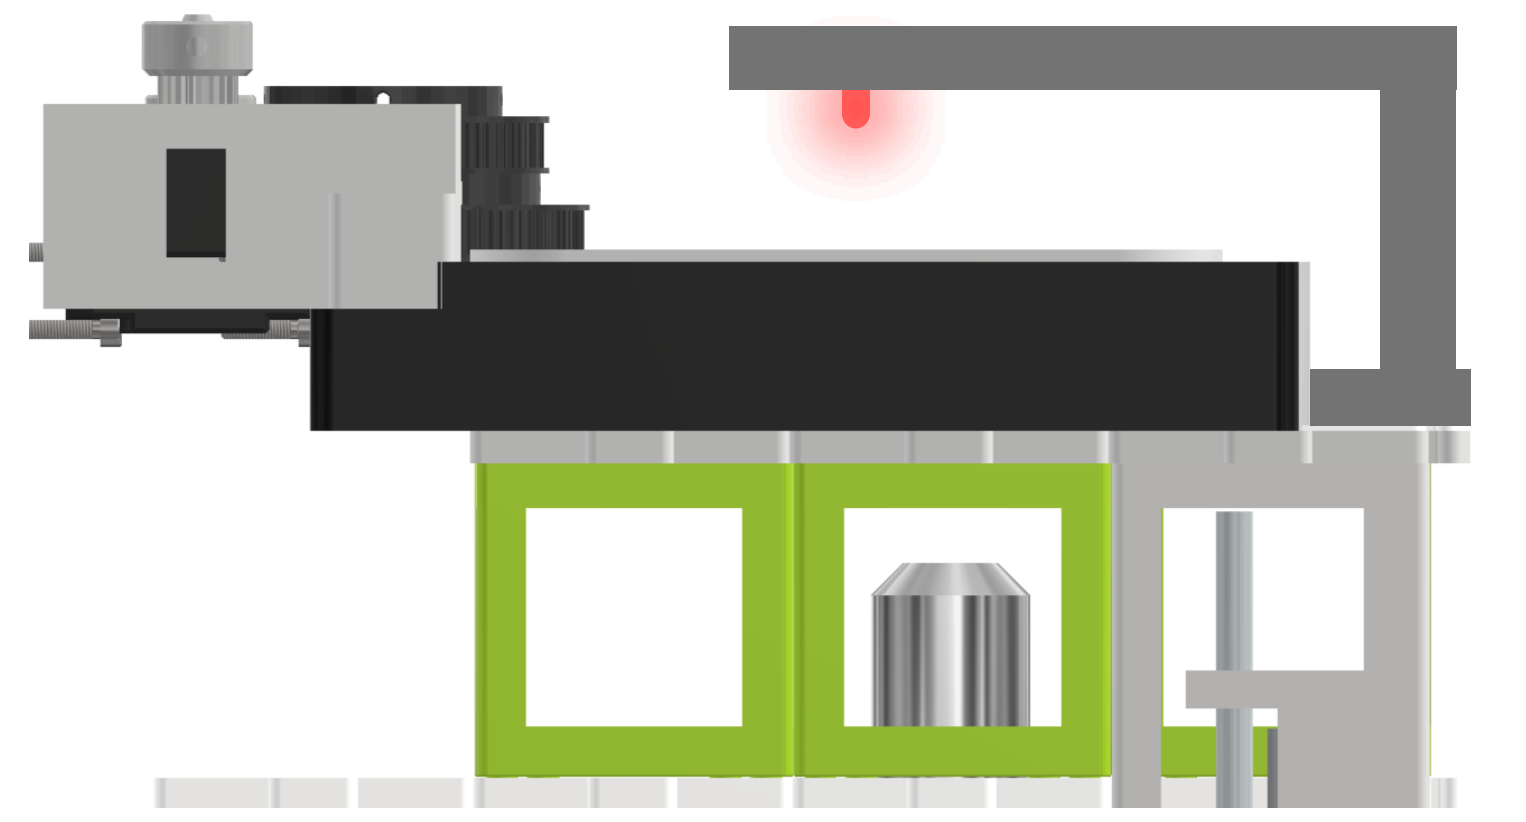
Fig. 8: Top light illumination via a 3D printed arm holding a red (635 nm) LED. Alternatively, a high-power white LED or an LED array can be used as top-light illumination.
Imaging with the UC2-STORM setup
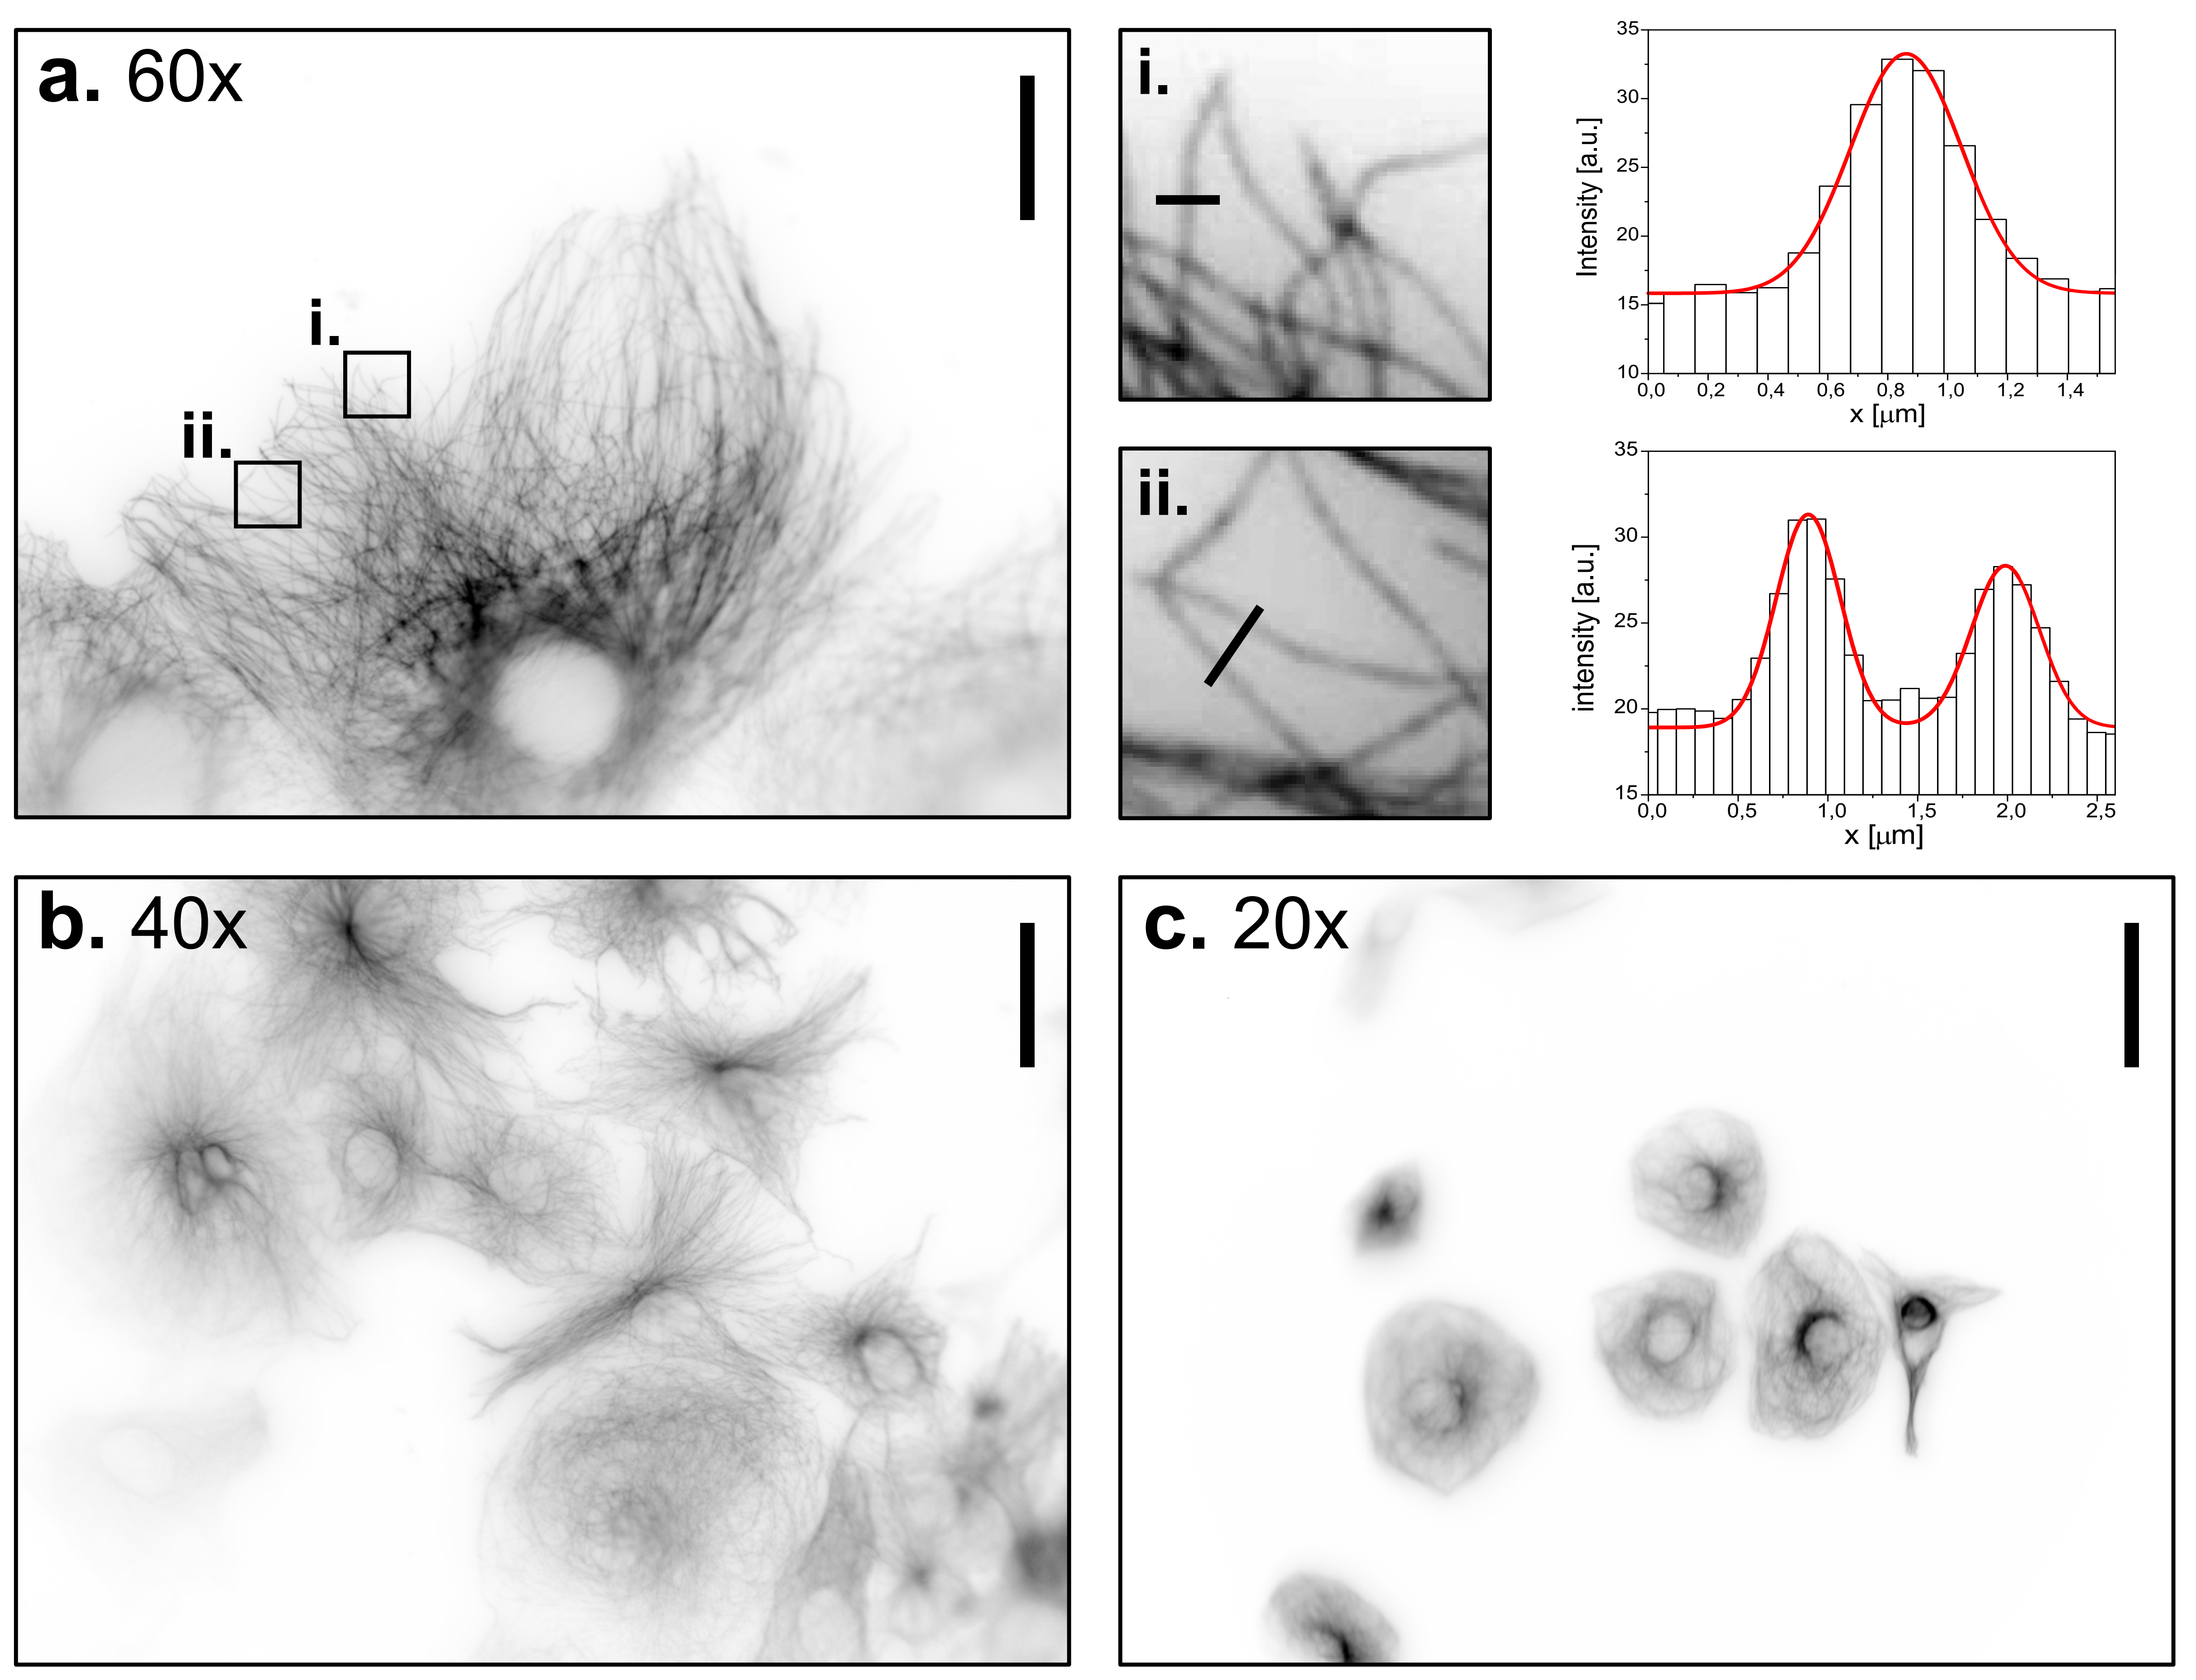
Widefield images of CV-1 cells immune-stained against tubulin, at different magnifications using the UC2 microscope. a. 60x objective, scale bar represents 30 µm. Two regions of interest have been zoomed in to demonstrate the ability to detect and characterize single microtubules. b. 40x objective, scale bar represents 45 µm. c. 20x objective, scale bar represents 90 µm.
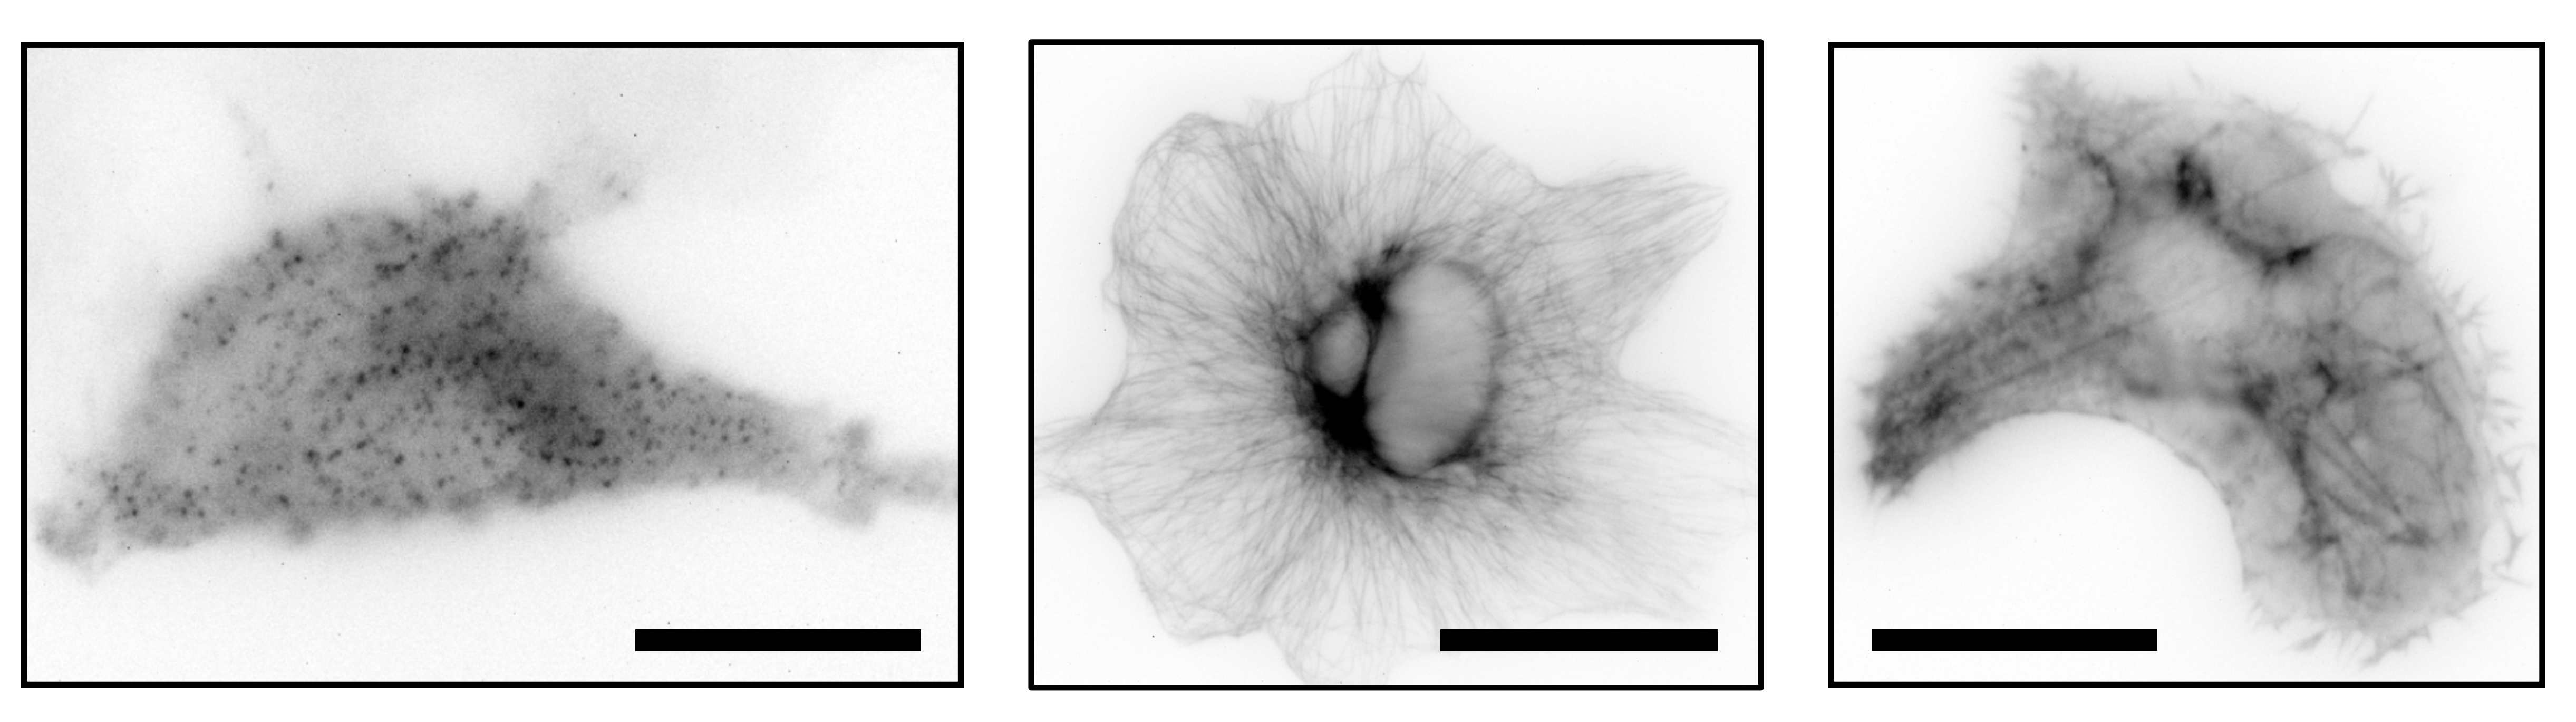
Widefield images of immune-stained clathrin coated pits (left), immune-stained tubulin (middle) and SiR Actin stain of CV-1 cells with the UC2 setup and a 60x objective. Scale bar represents 25 µm.
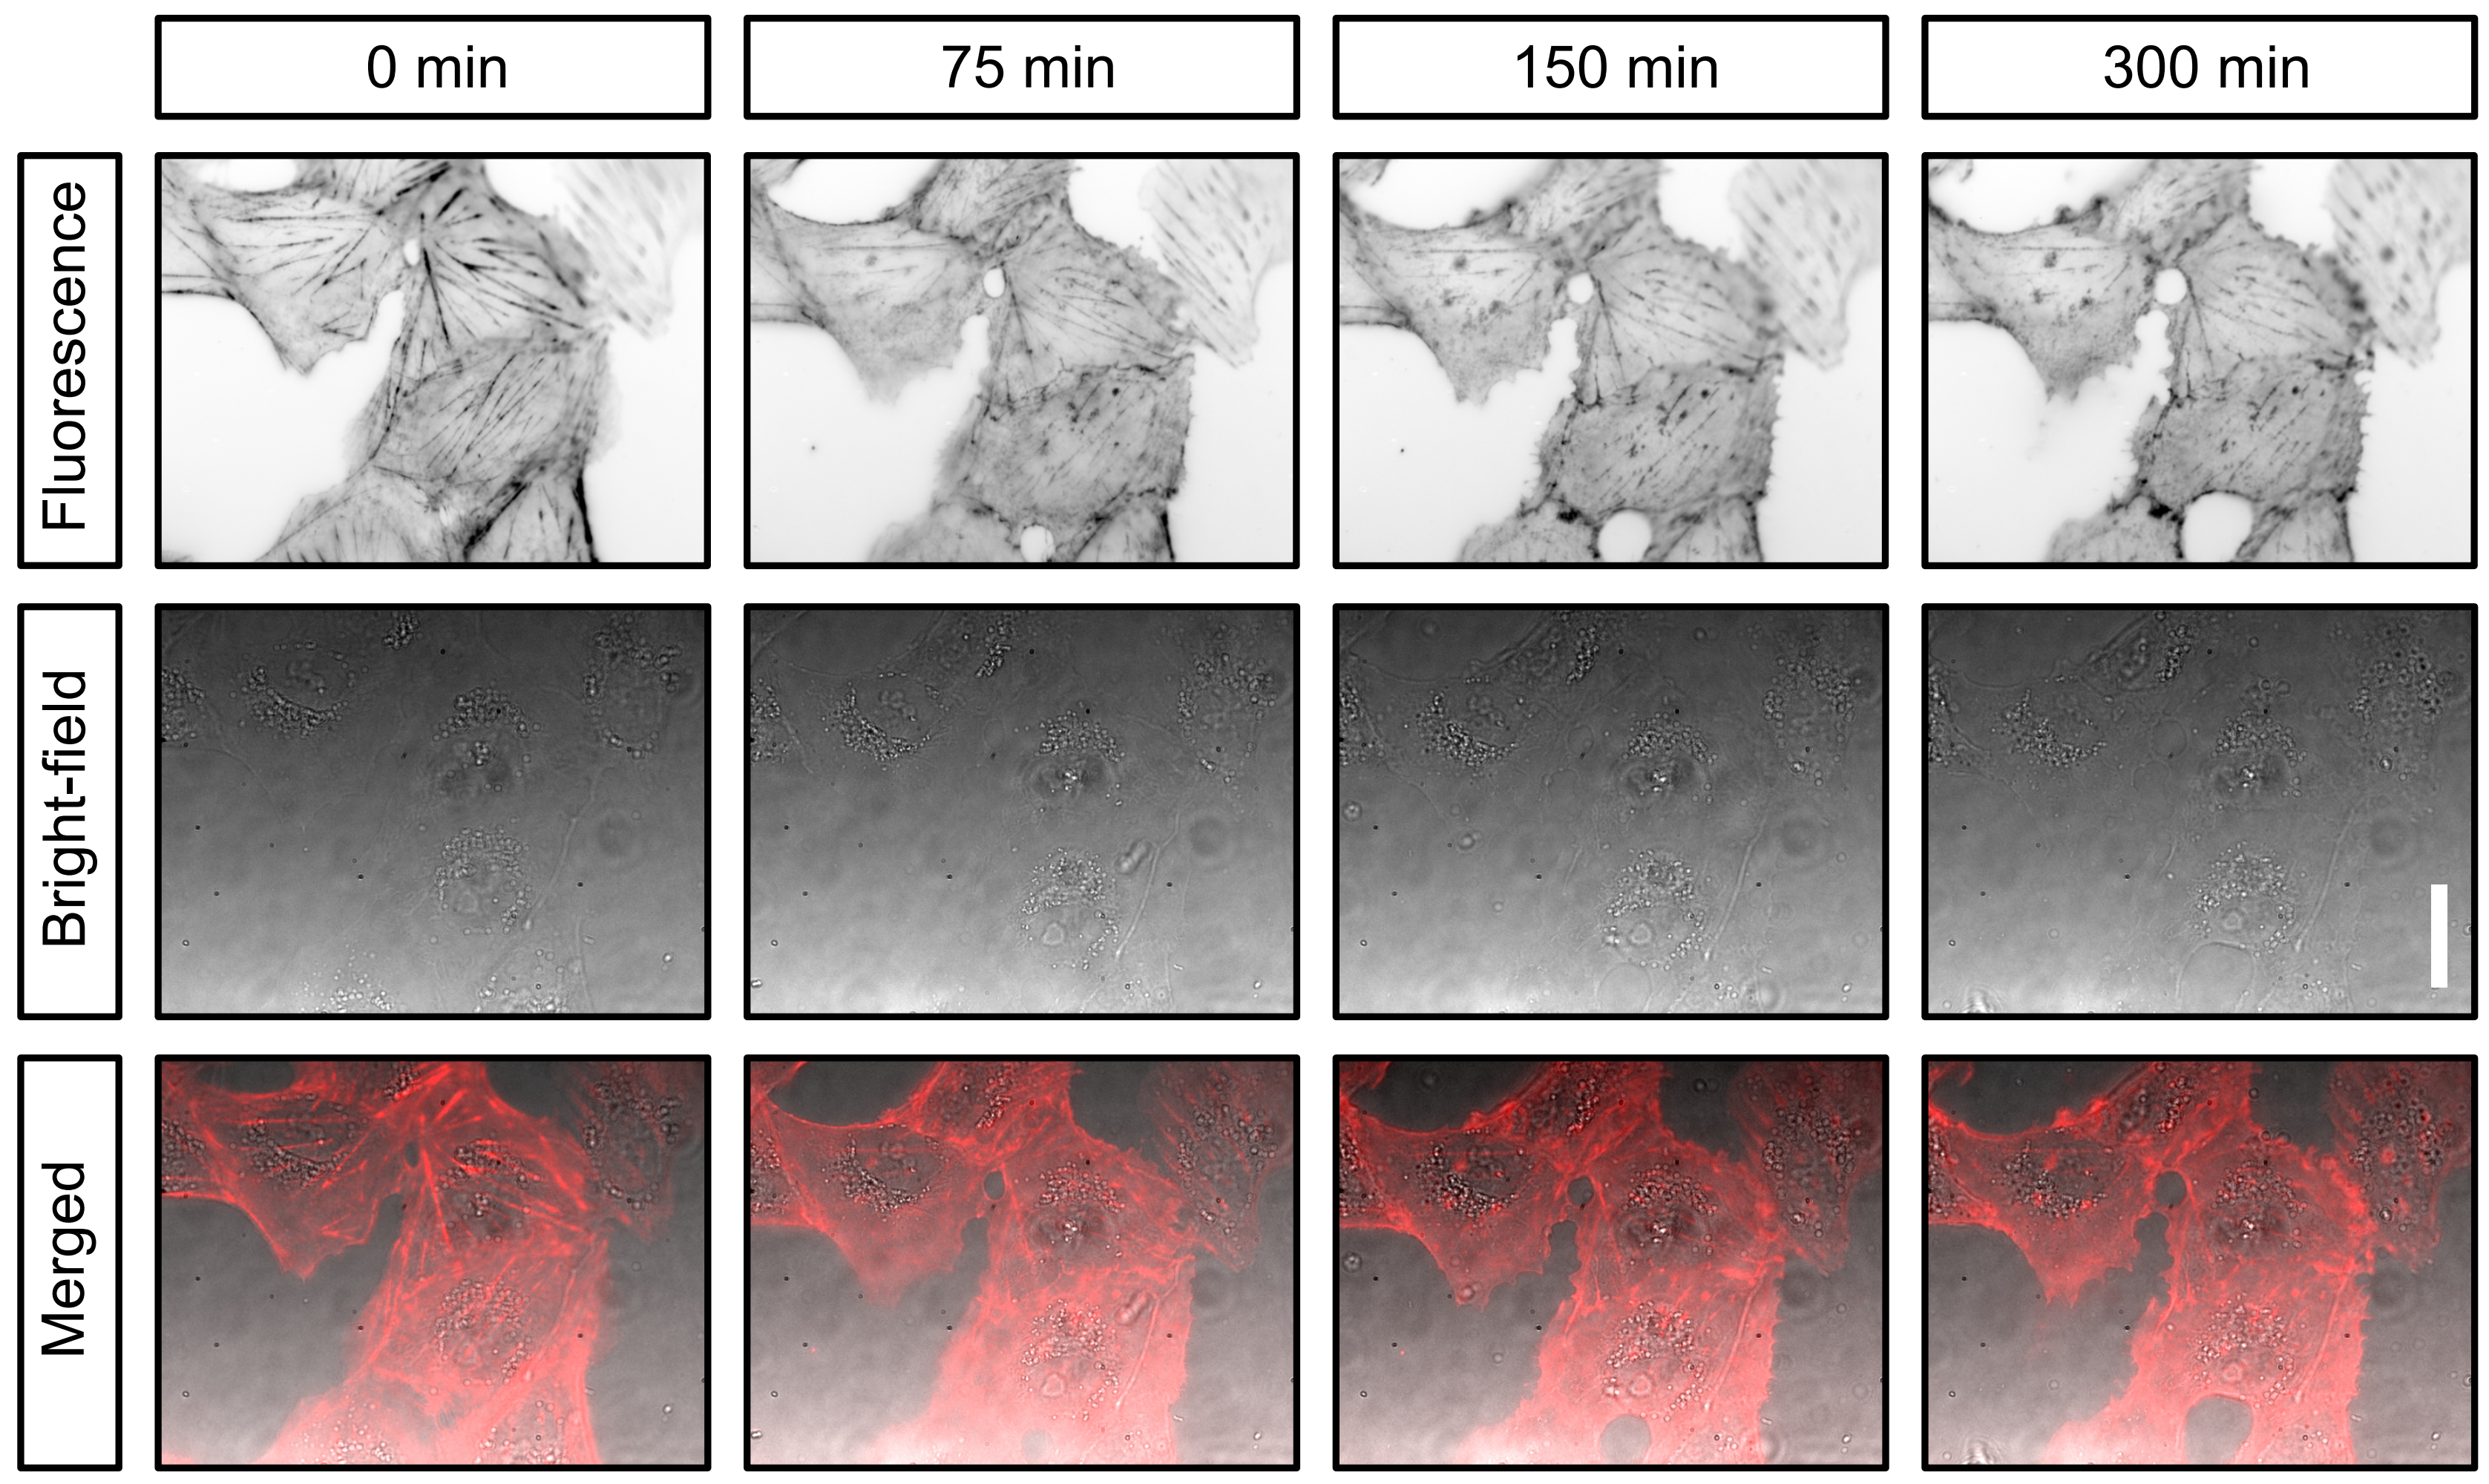
Live cell imaging of CV-1 cells stained with SiR actin over a period of five hours.
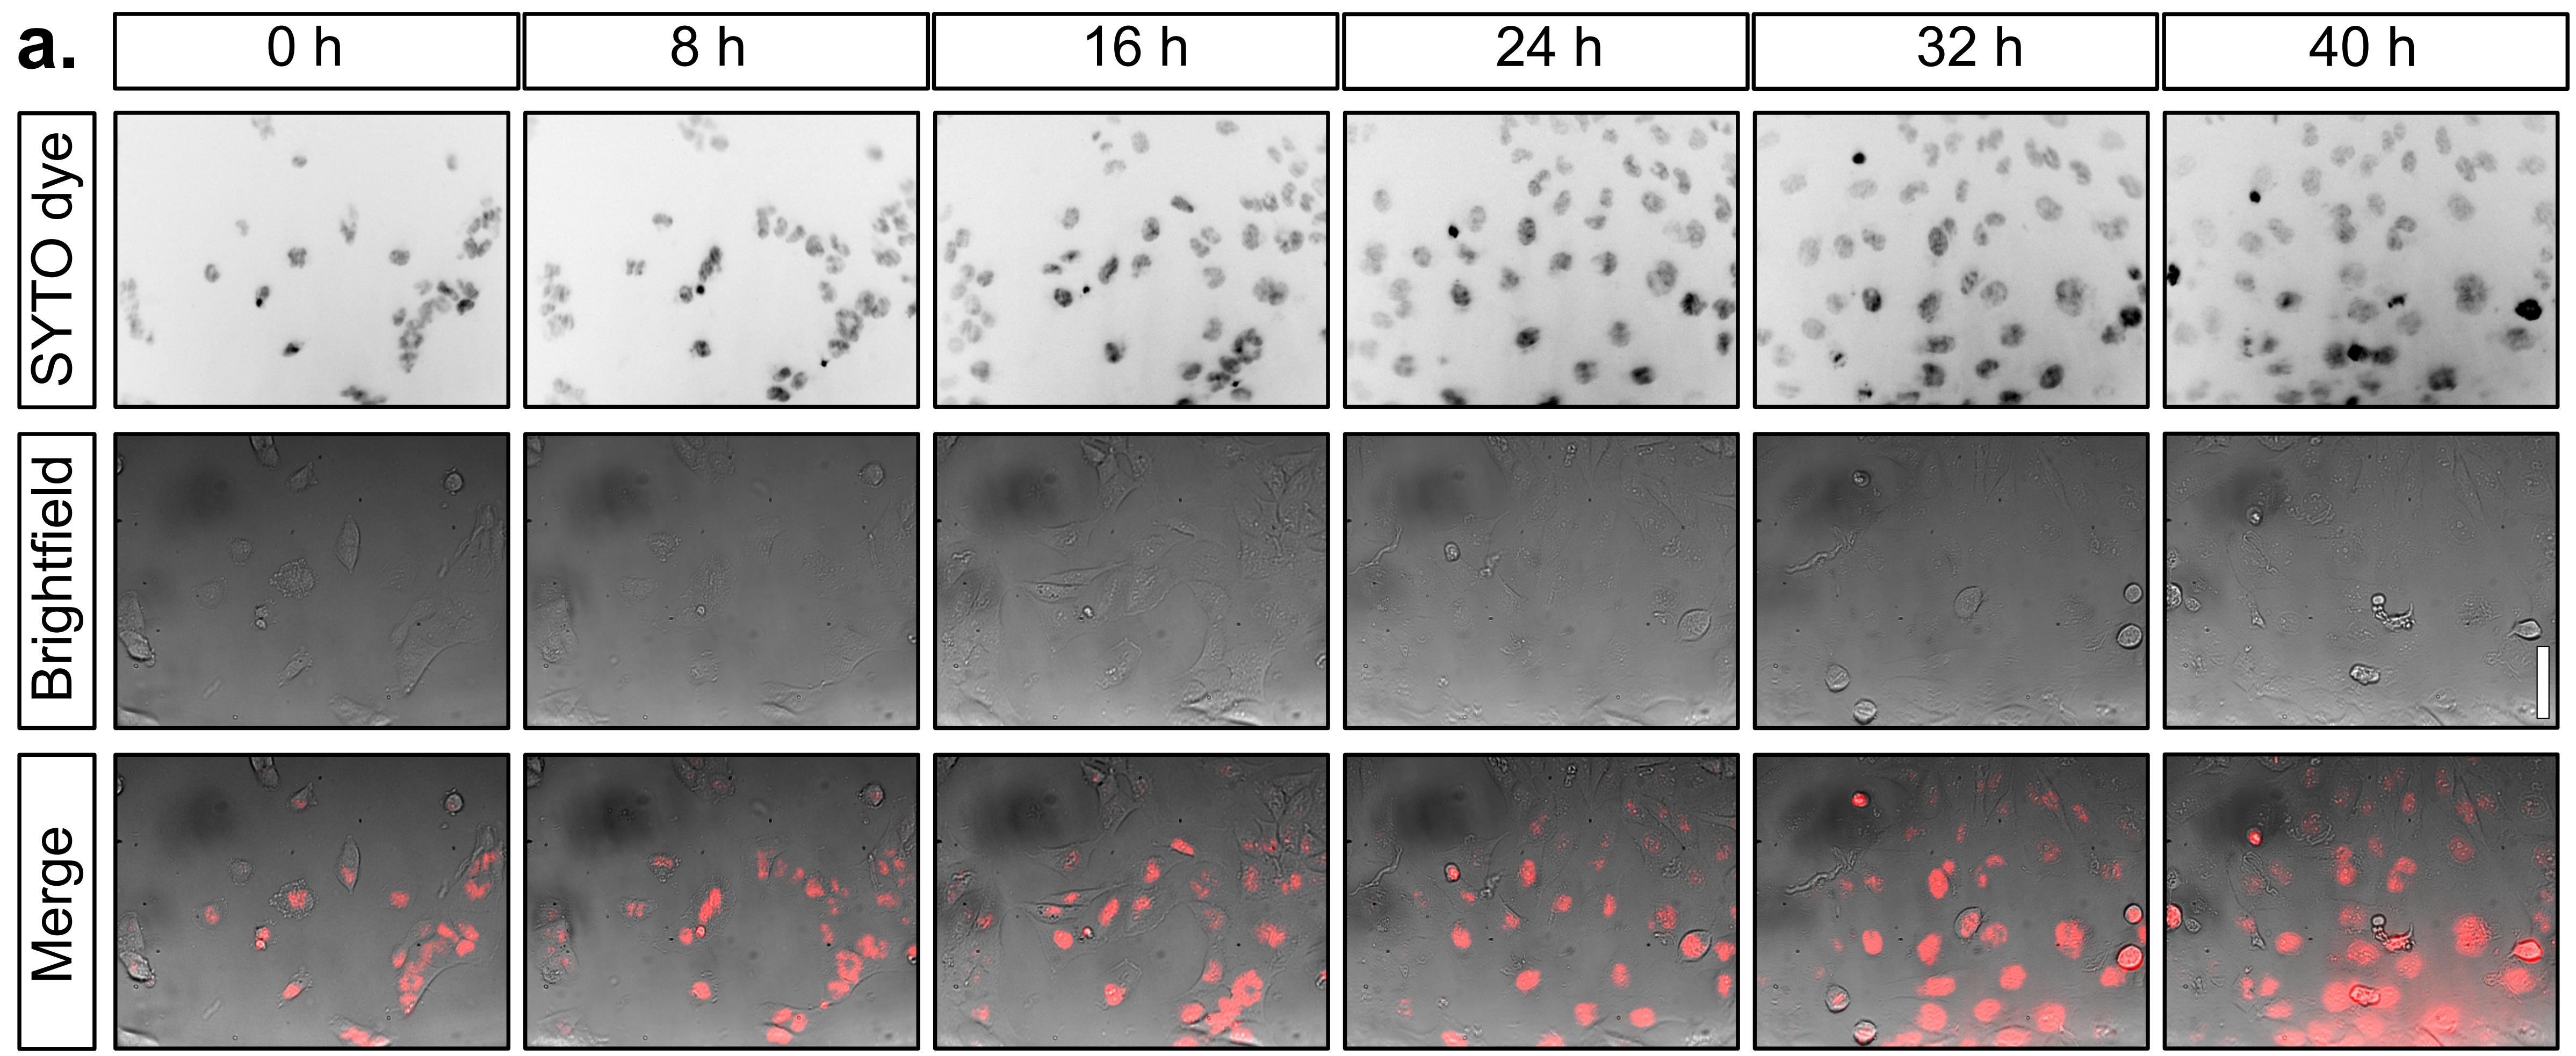
Live cell imaging of T98G cells stained with SYTO far red nucleic dye over a period of two days within an incubator.
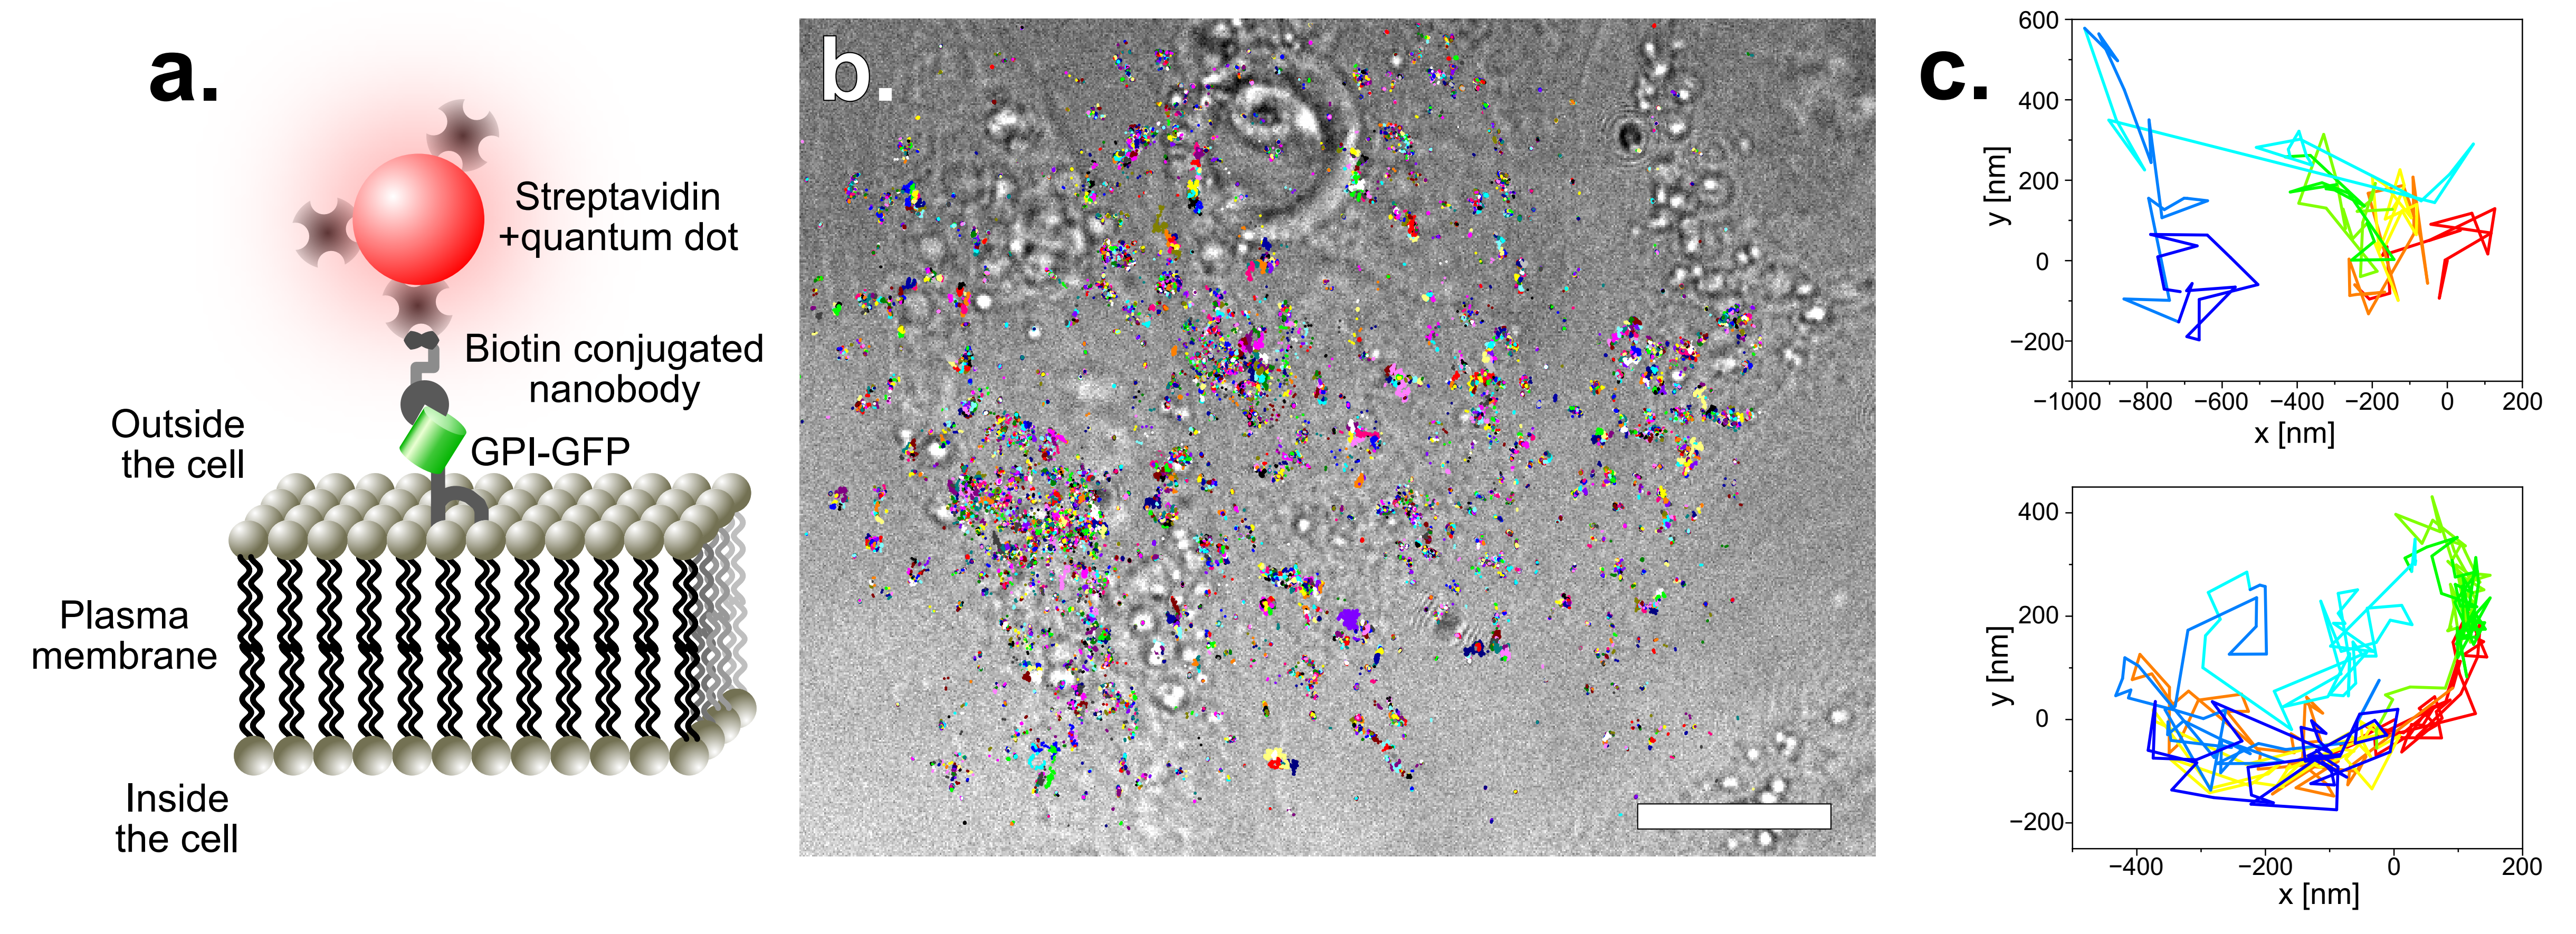
Single particle tracking of GPI-GFP on HeLa cells. For more photostability, the tracks are acquired by imaging quantum dots. These have been functionalized with straptavidin and are attached to GFP via biotin conjugated anti-GFP nanobodies. The construct is schematically disaplayed in a. The acquired tracks are overlayed on a bright-field image of the HeLa cells (b.) (scale bar represents 10 µm). Two single tracks are exeplarily displayed in c.
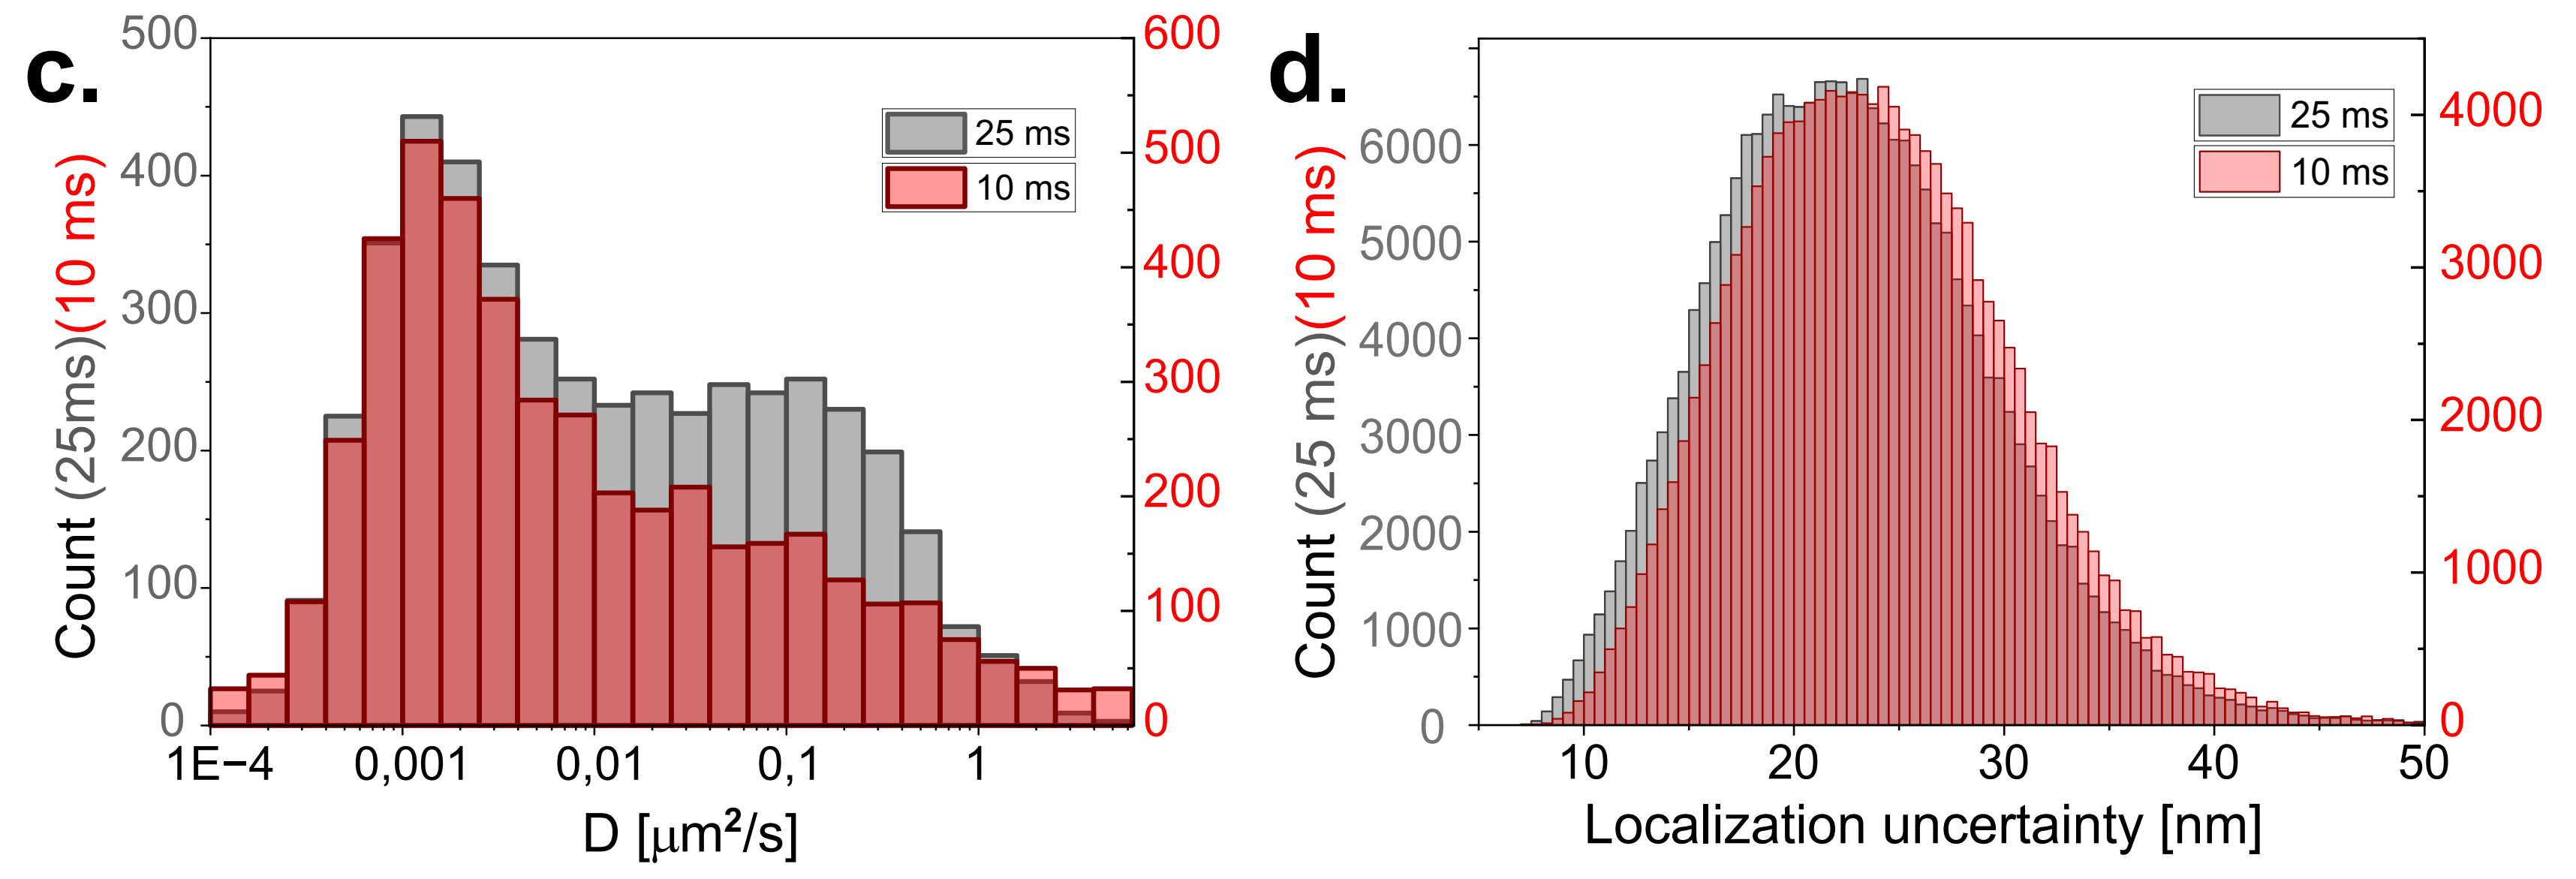
Diffusion coefficient of the tracked quantum dots with 10 and 25 ms exposure time of the camera. To have similar localization uncertainties, the laser power was doubled for the shorter exposure time. Two populations can be identified. The first one has a slower diffusion and corresponds to particles which are stuck or simply immobile. The other population which seems to have a maximum around and corresponds to the random diffusion of GPI on the cell membrane.
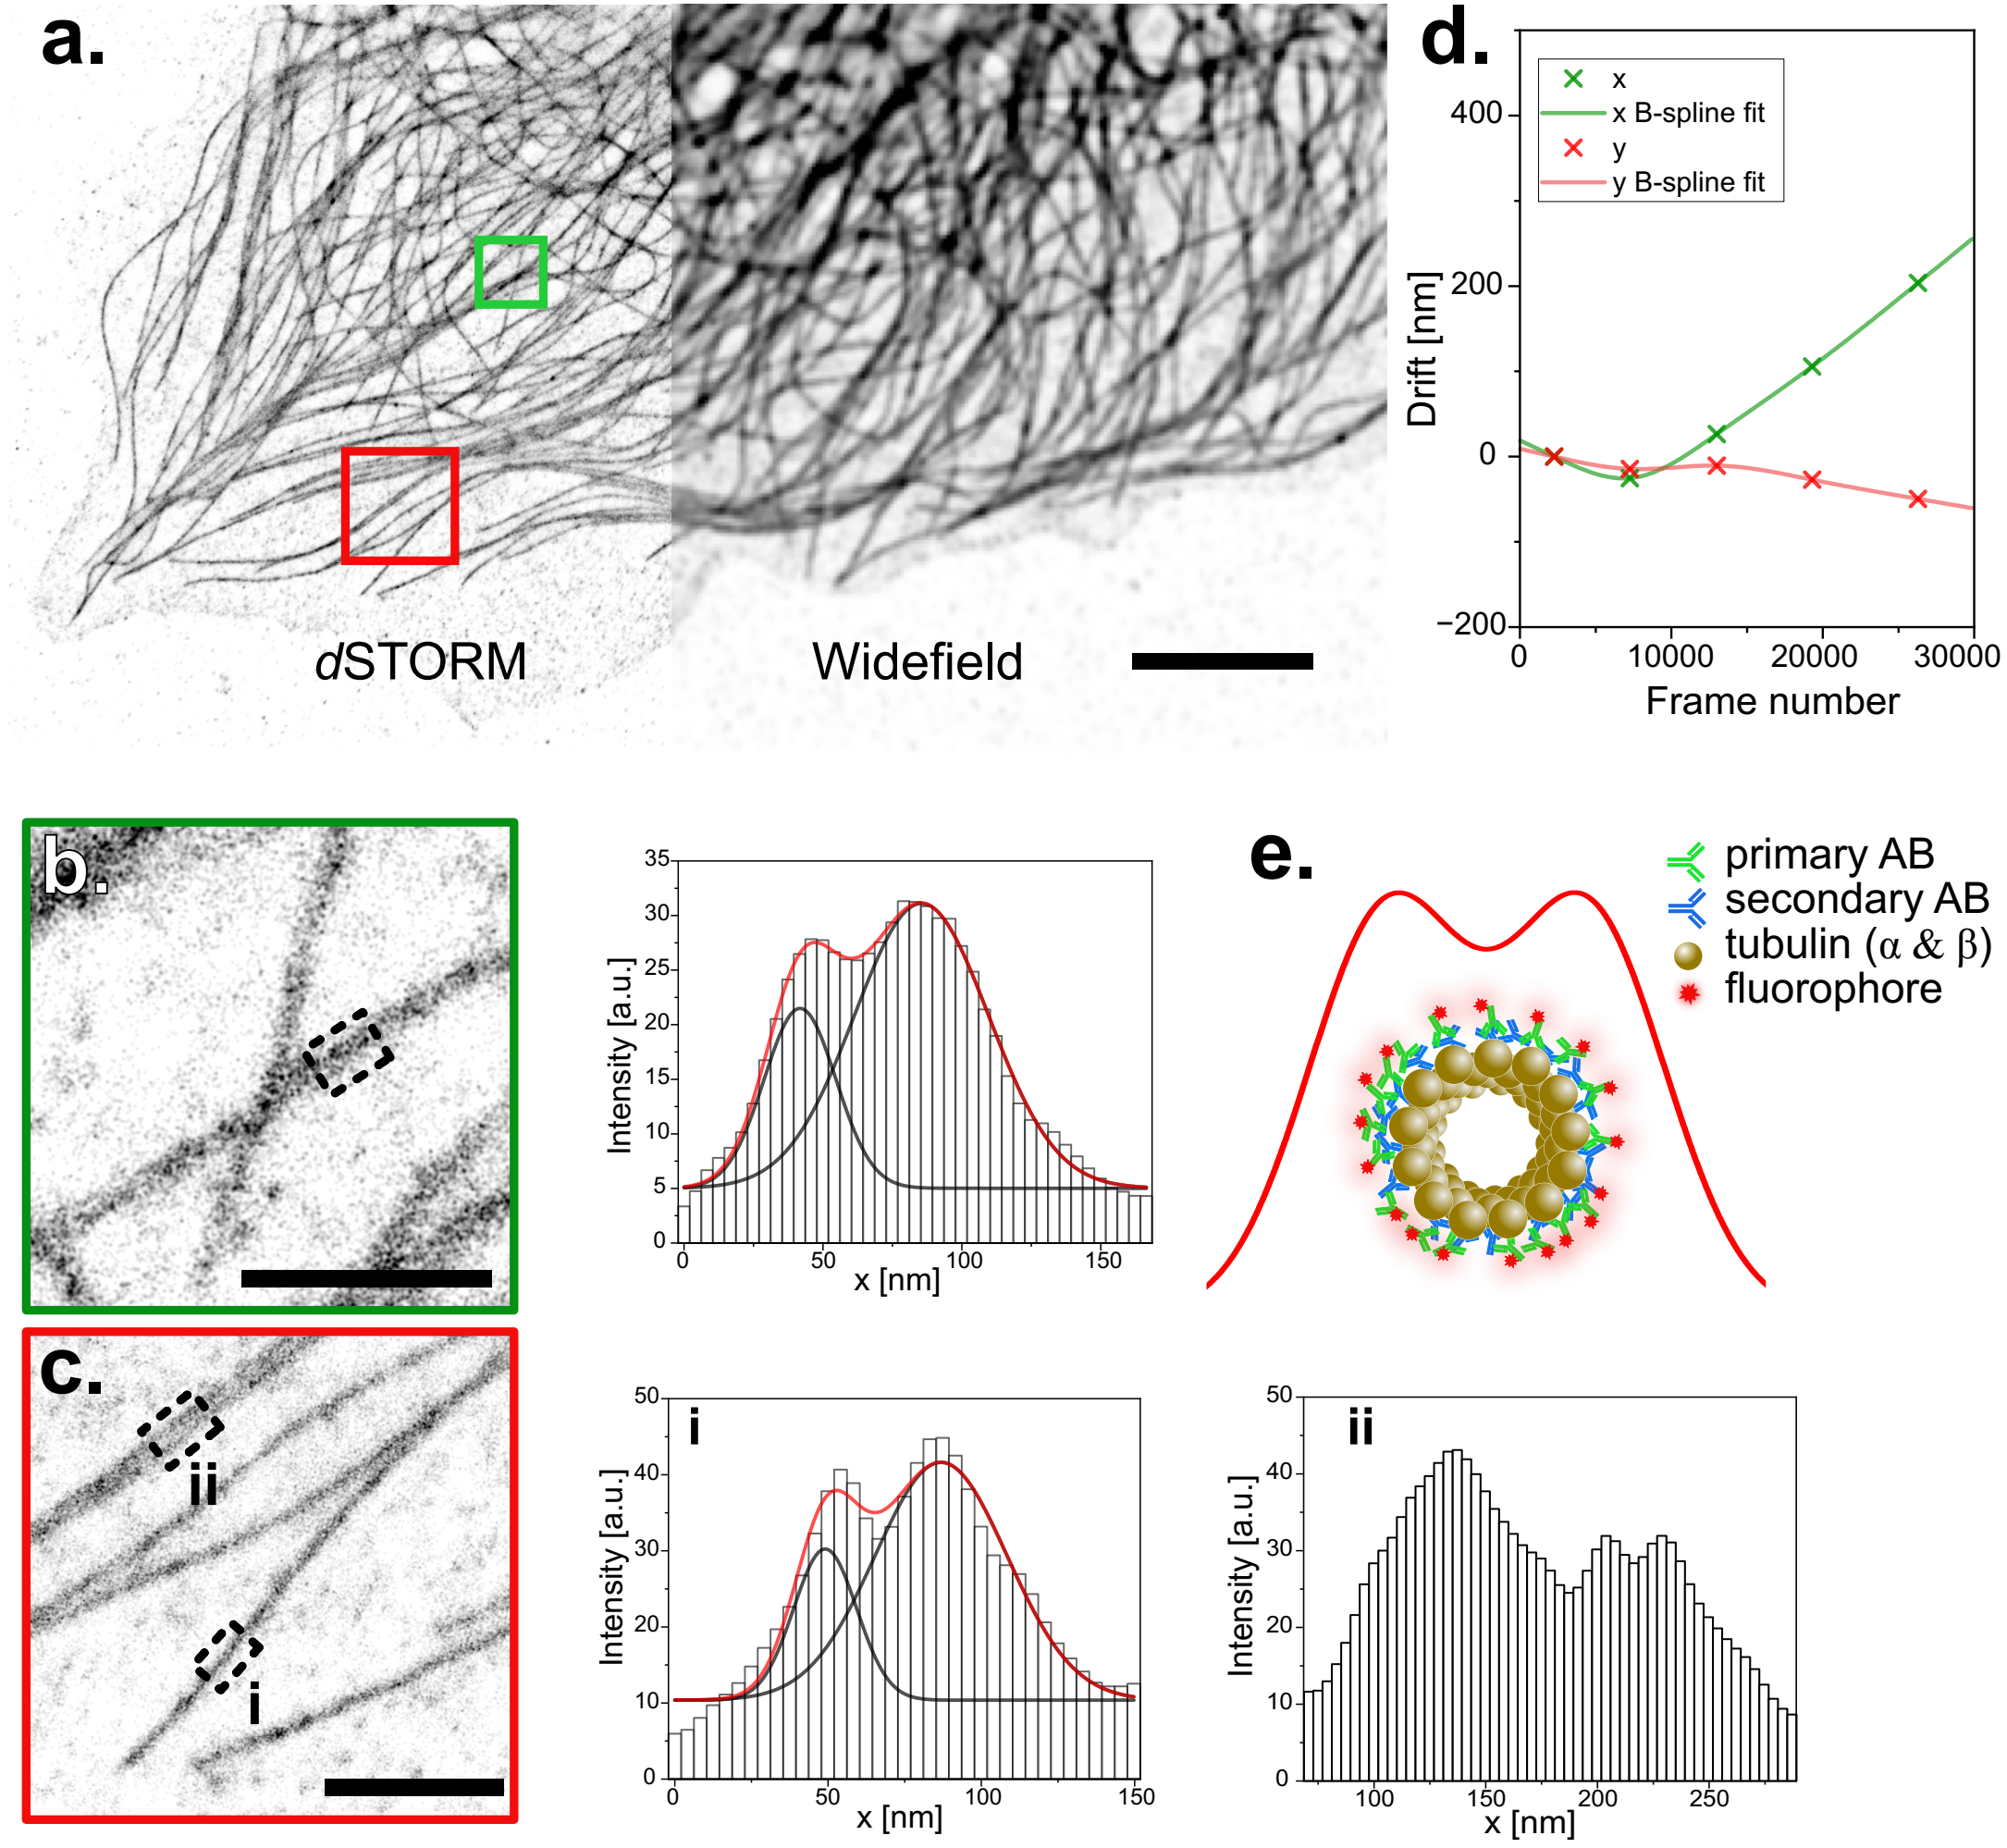
dSTORM image of microtubules reconstructed from wide-field images acquired on the UC2. a. Immuno-stained microtubules in CV-1 cells are shown in wide-field and with dSTORM. Scale bar represents 5 µm. b. and c. show the averaged profiles along 200 nm of microtubules within two regions of interest. Profiles are fitted with a double Gaussian. Peak to peak distances of (38±2) nm for b and (43±2) nm for c.i are extrapolated. Scale bar represents 1 µm in the magnified ROIs. d. Drift measured by cross-correlation during the raw-data acquisition period of the reconstructed image displayed in a. e. Simplified schematic of the front view of a microtubule sample after immuno-staining and the resulting railroad tracks.
Imaging with lower-budget objectives
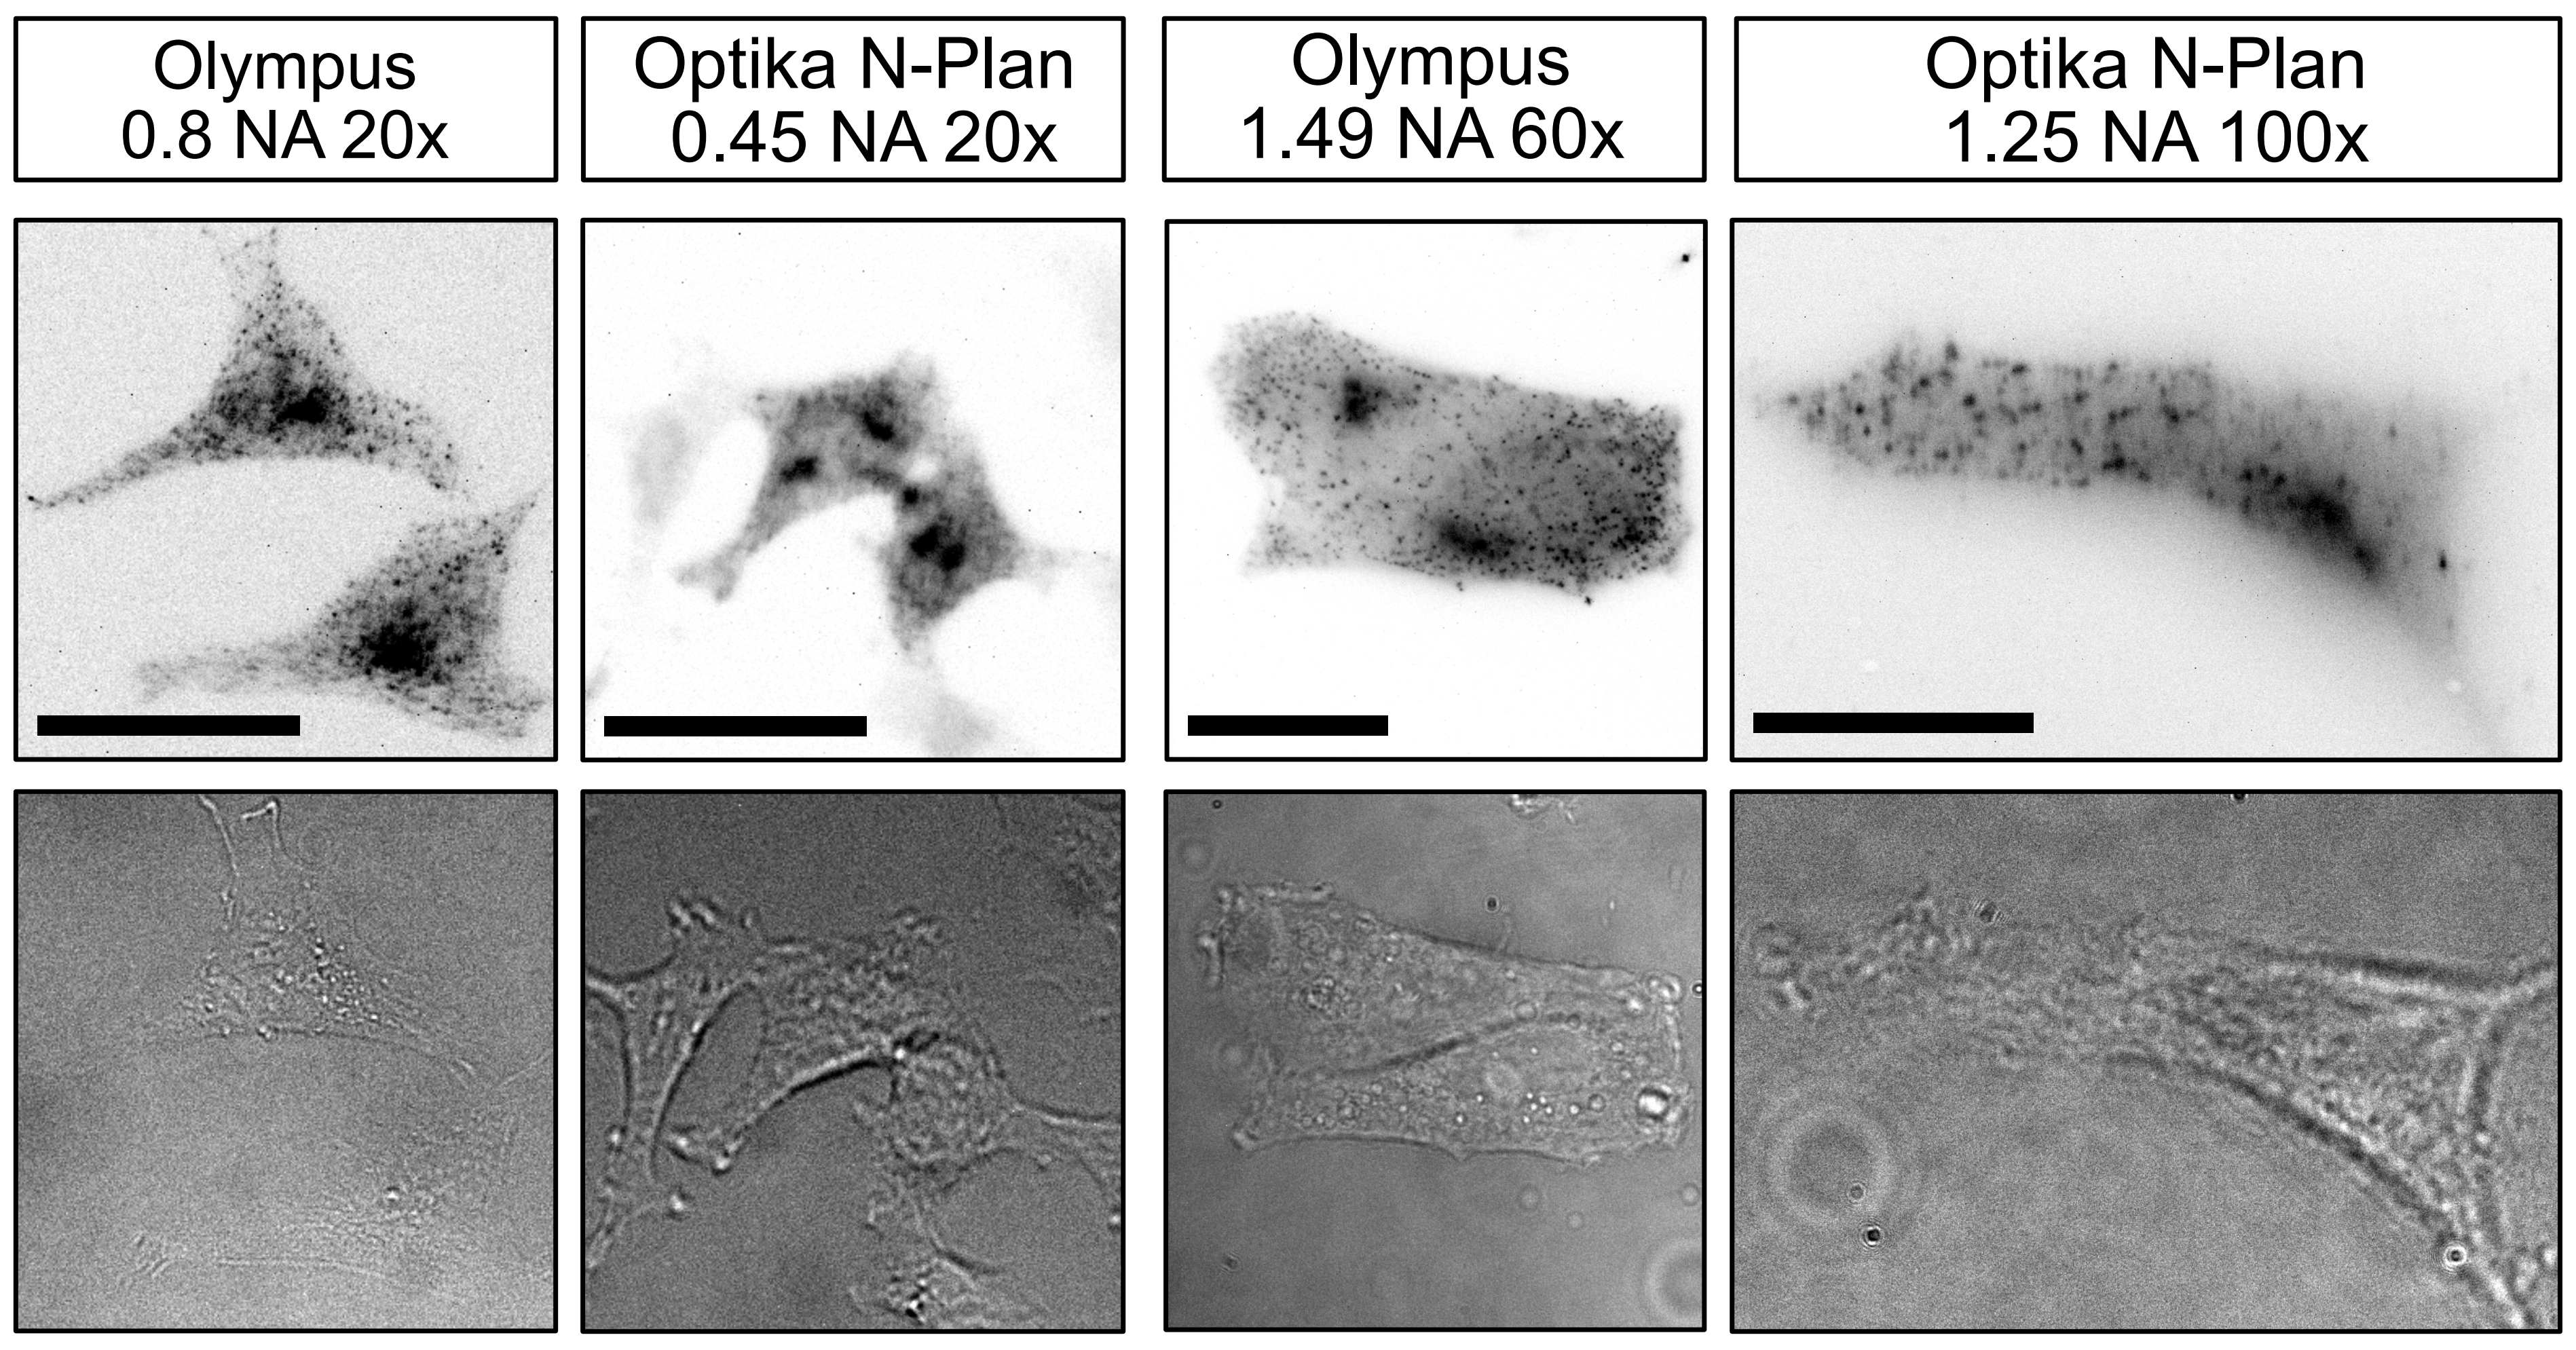
Stable HeLa cell-line with Clathrin light chain-GFP stained with AF647 conjugated anti-GFP nanobodies, in the fluorescence as well as the brightfield channel. Images have been acquired with the different objectives listed in the top of the image. The scale bars in the 20 ×, 60 × and 100 × magnified images respectively represent 30 µm.
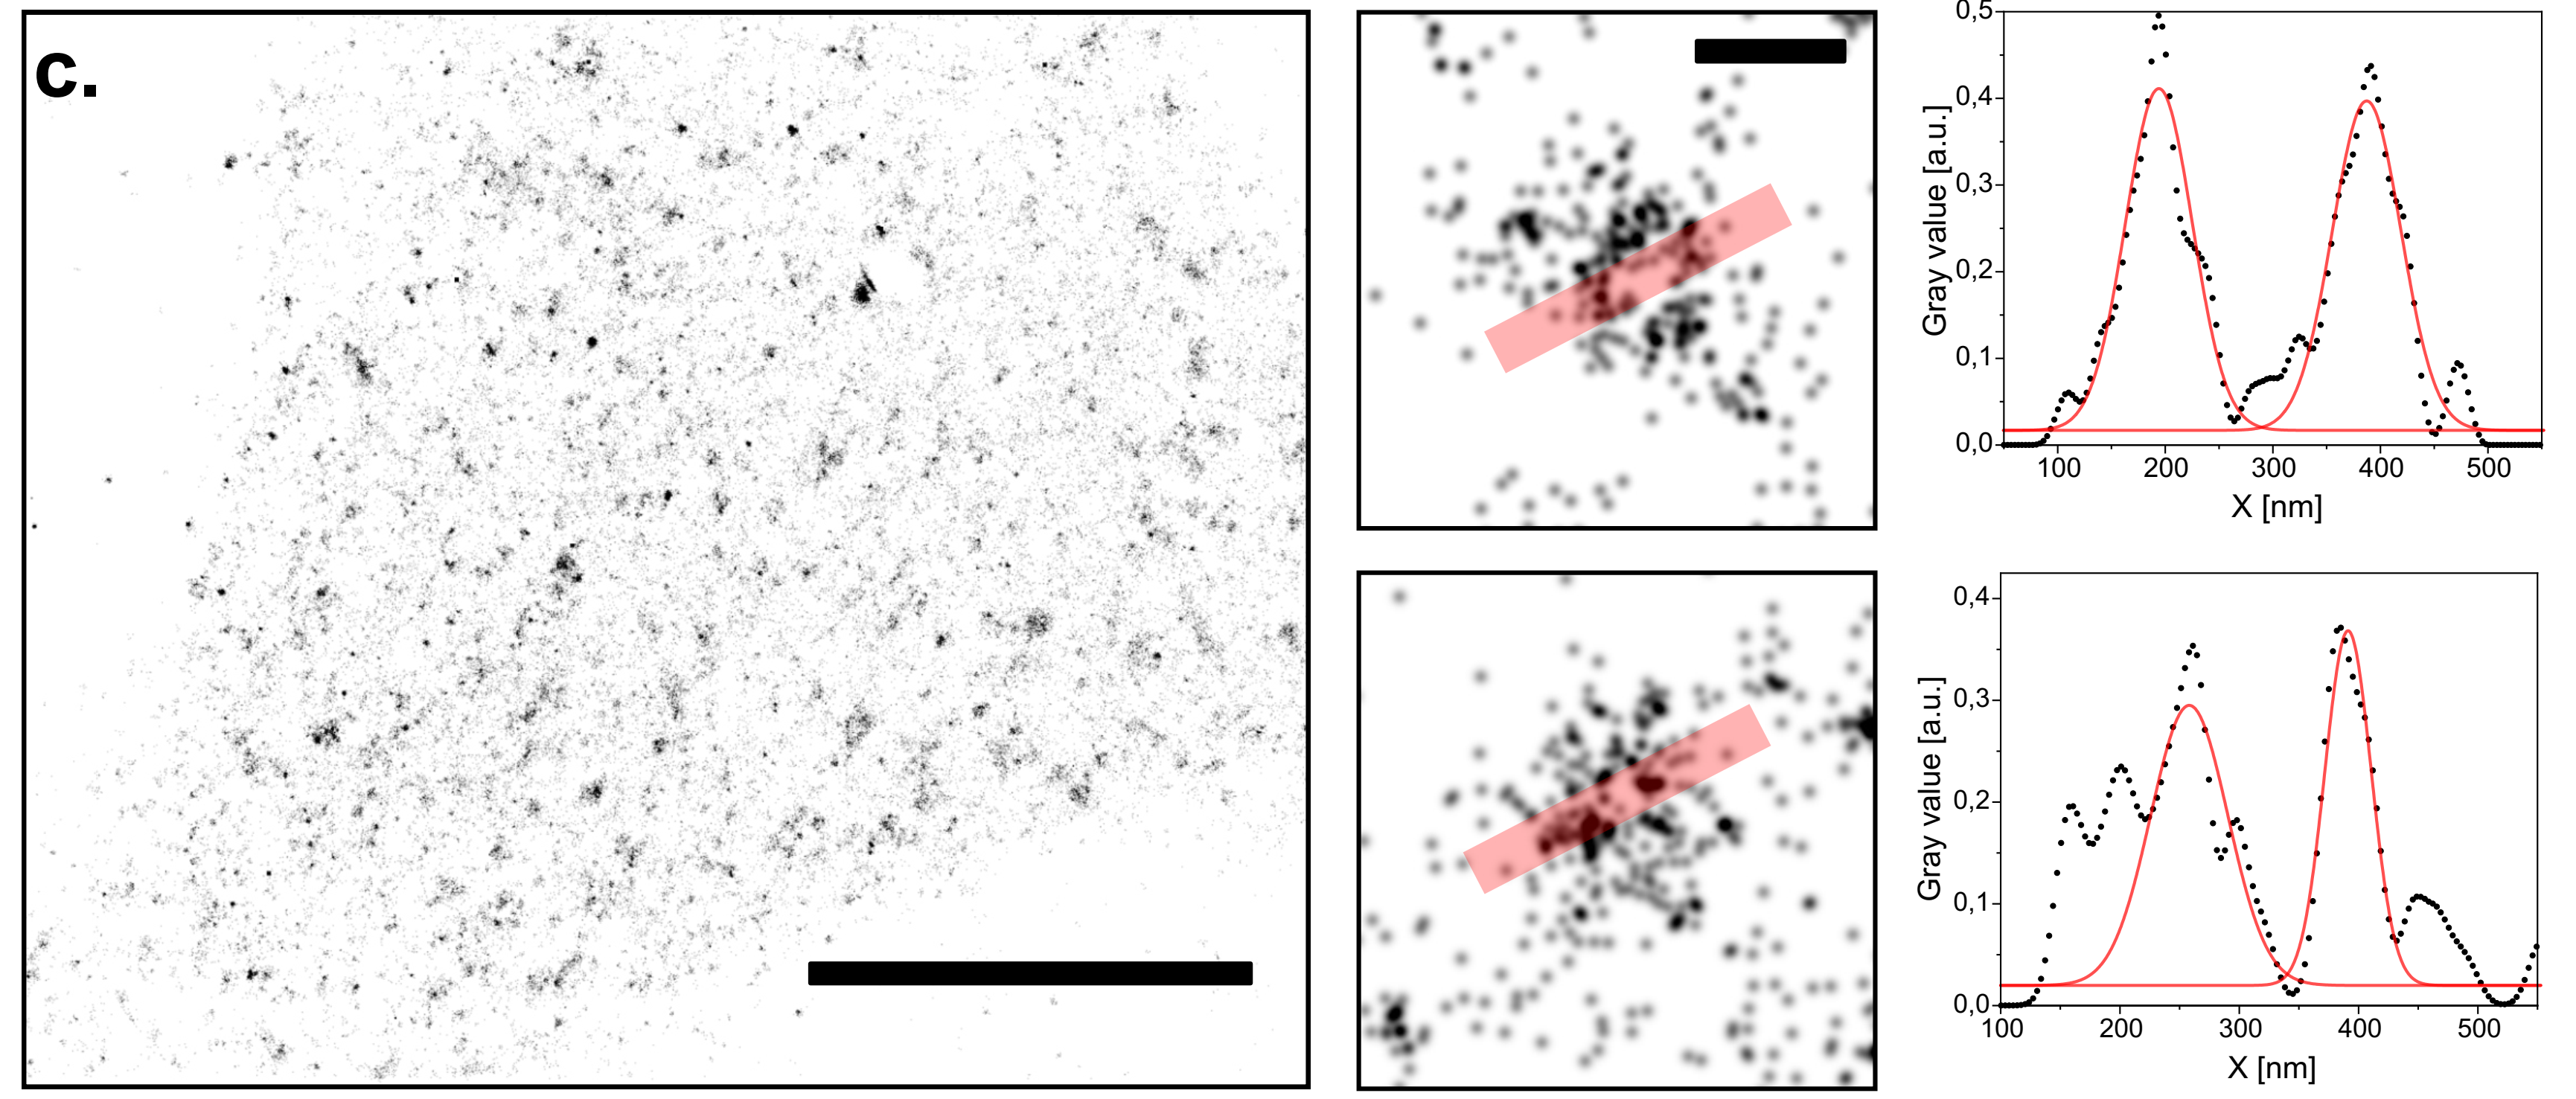
Single molecule localization microscopy (dSTORM) on the UC2 setup with a low-budget objective. Reconstruction of CLC-GFP in HeLa cells immuno-stained with AF647 conjugated nanobodies. Scale bar for represents 10 µm. Two CCPs have been zoomed in to plot the profiles along the red transparent line. Scale bar for the magnified regions of interest represents 200 nm.