Results
Imaging with the UC2-STORM setup
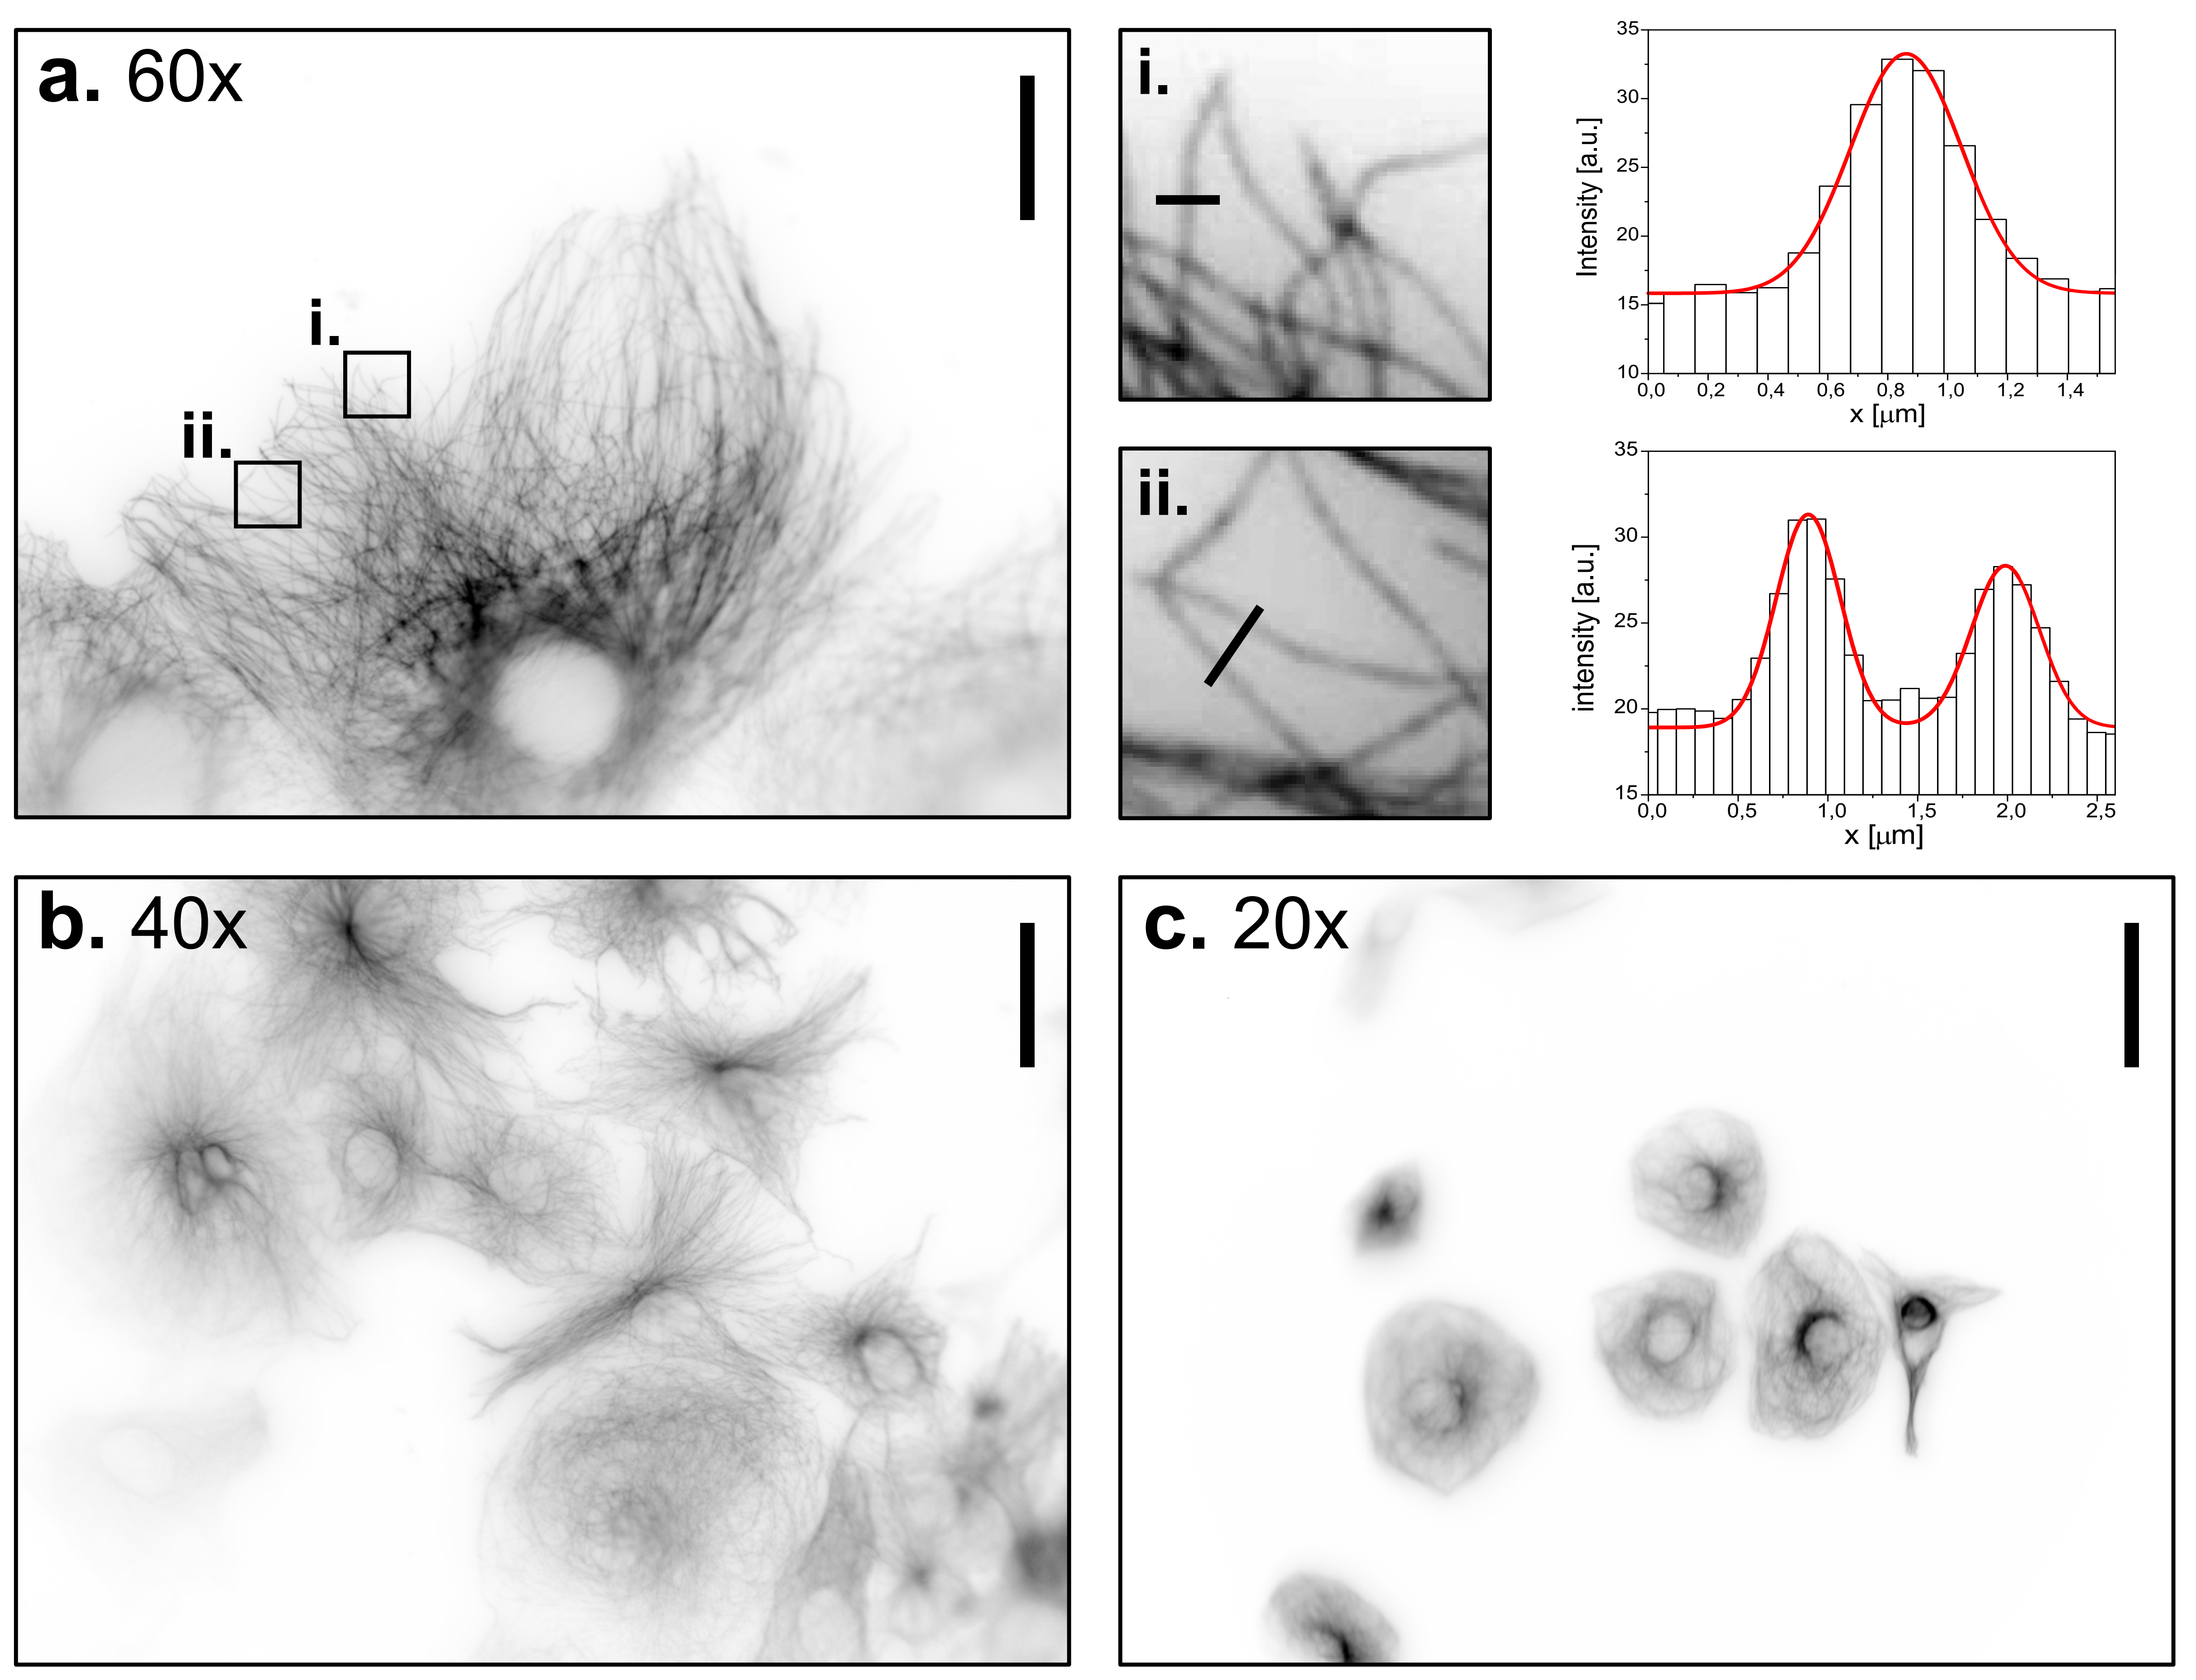
Widefield images of CV-1 cells immune-stained against tubulin, at different magnifications using the UC2 microscope. a. 60x objective, scale bar represents 30 µm. Two regions of interest have been zoomed in to demonstrate the ability to detect and characterize single microtubules. b. 40x objective, scale bar represents 45 µm. c. 20x objective, scale bar represents 90 µm.
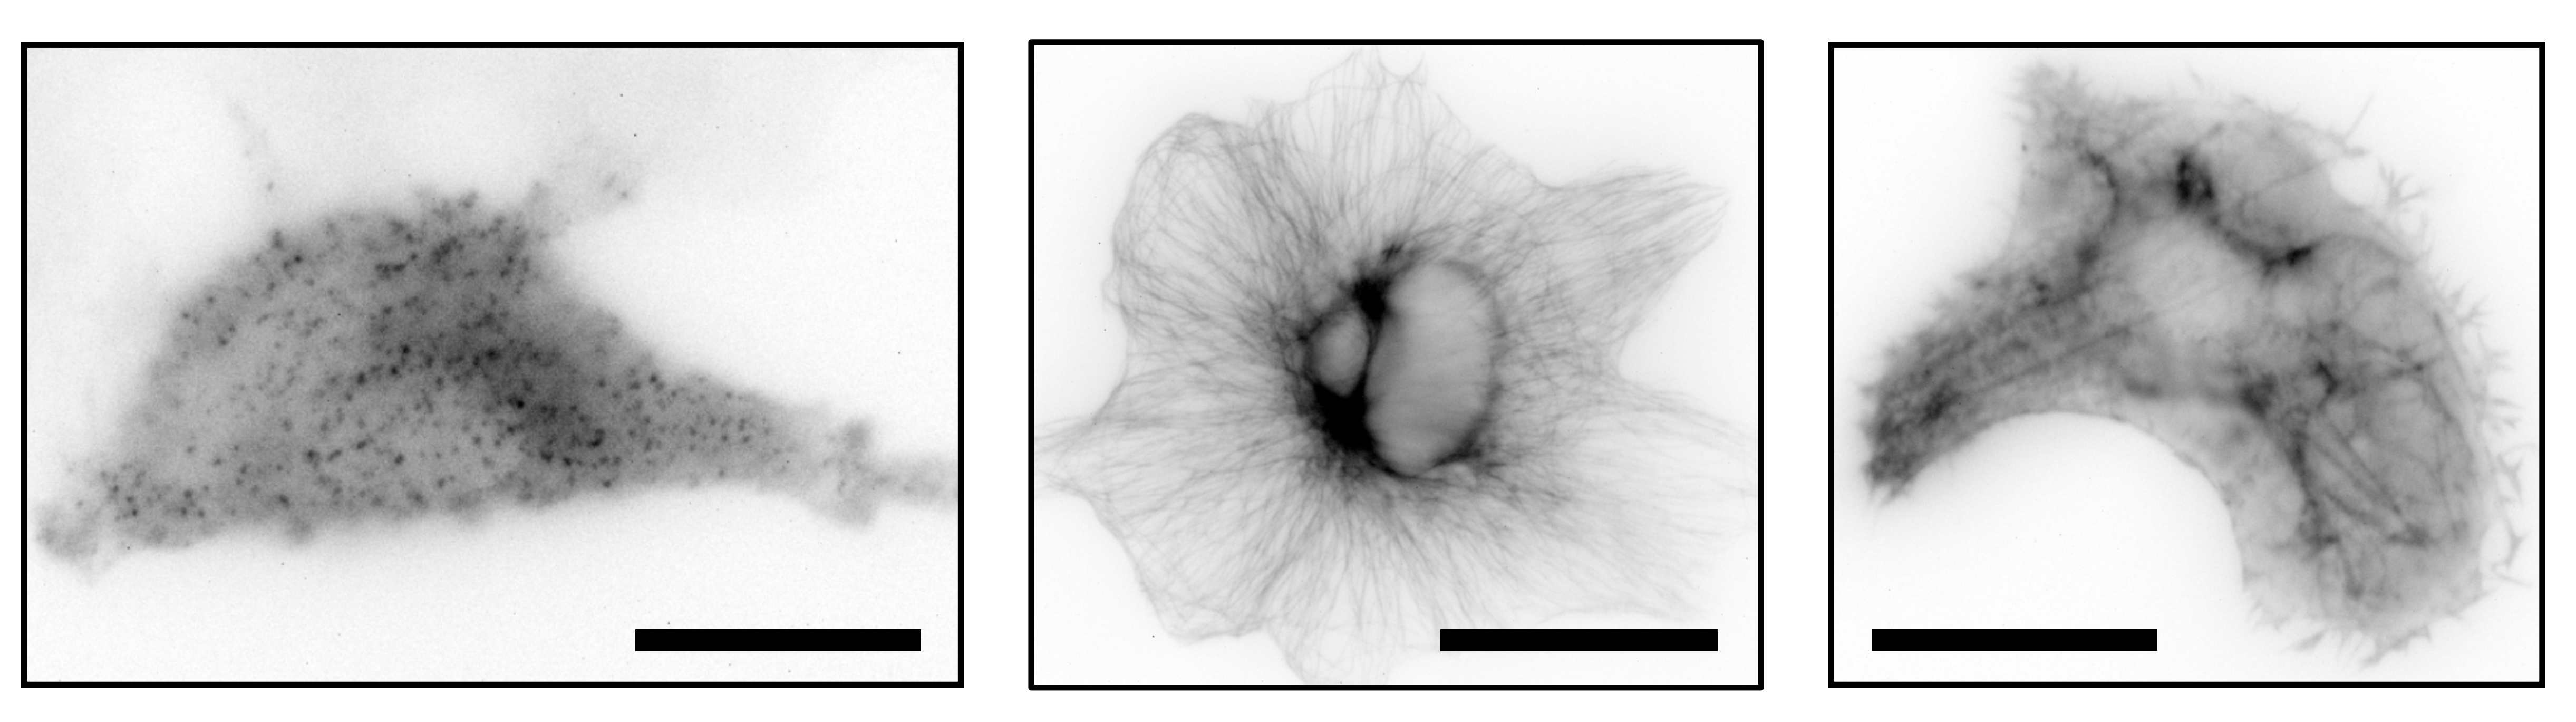
Widefield images of immune-stained clathrin coated pits (left), immune-stained tubulin (middle) and SiR Actin stain of CV-1 cells with the UC2 setup and a 60x objective. Scale bar represents 25 µm.
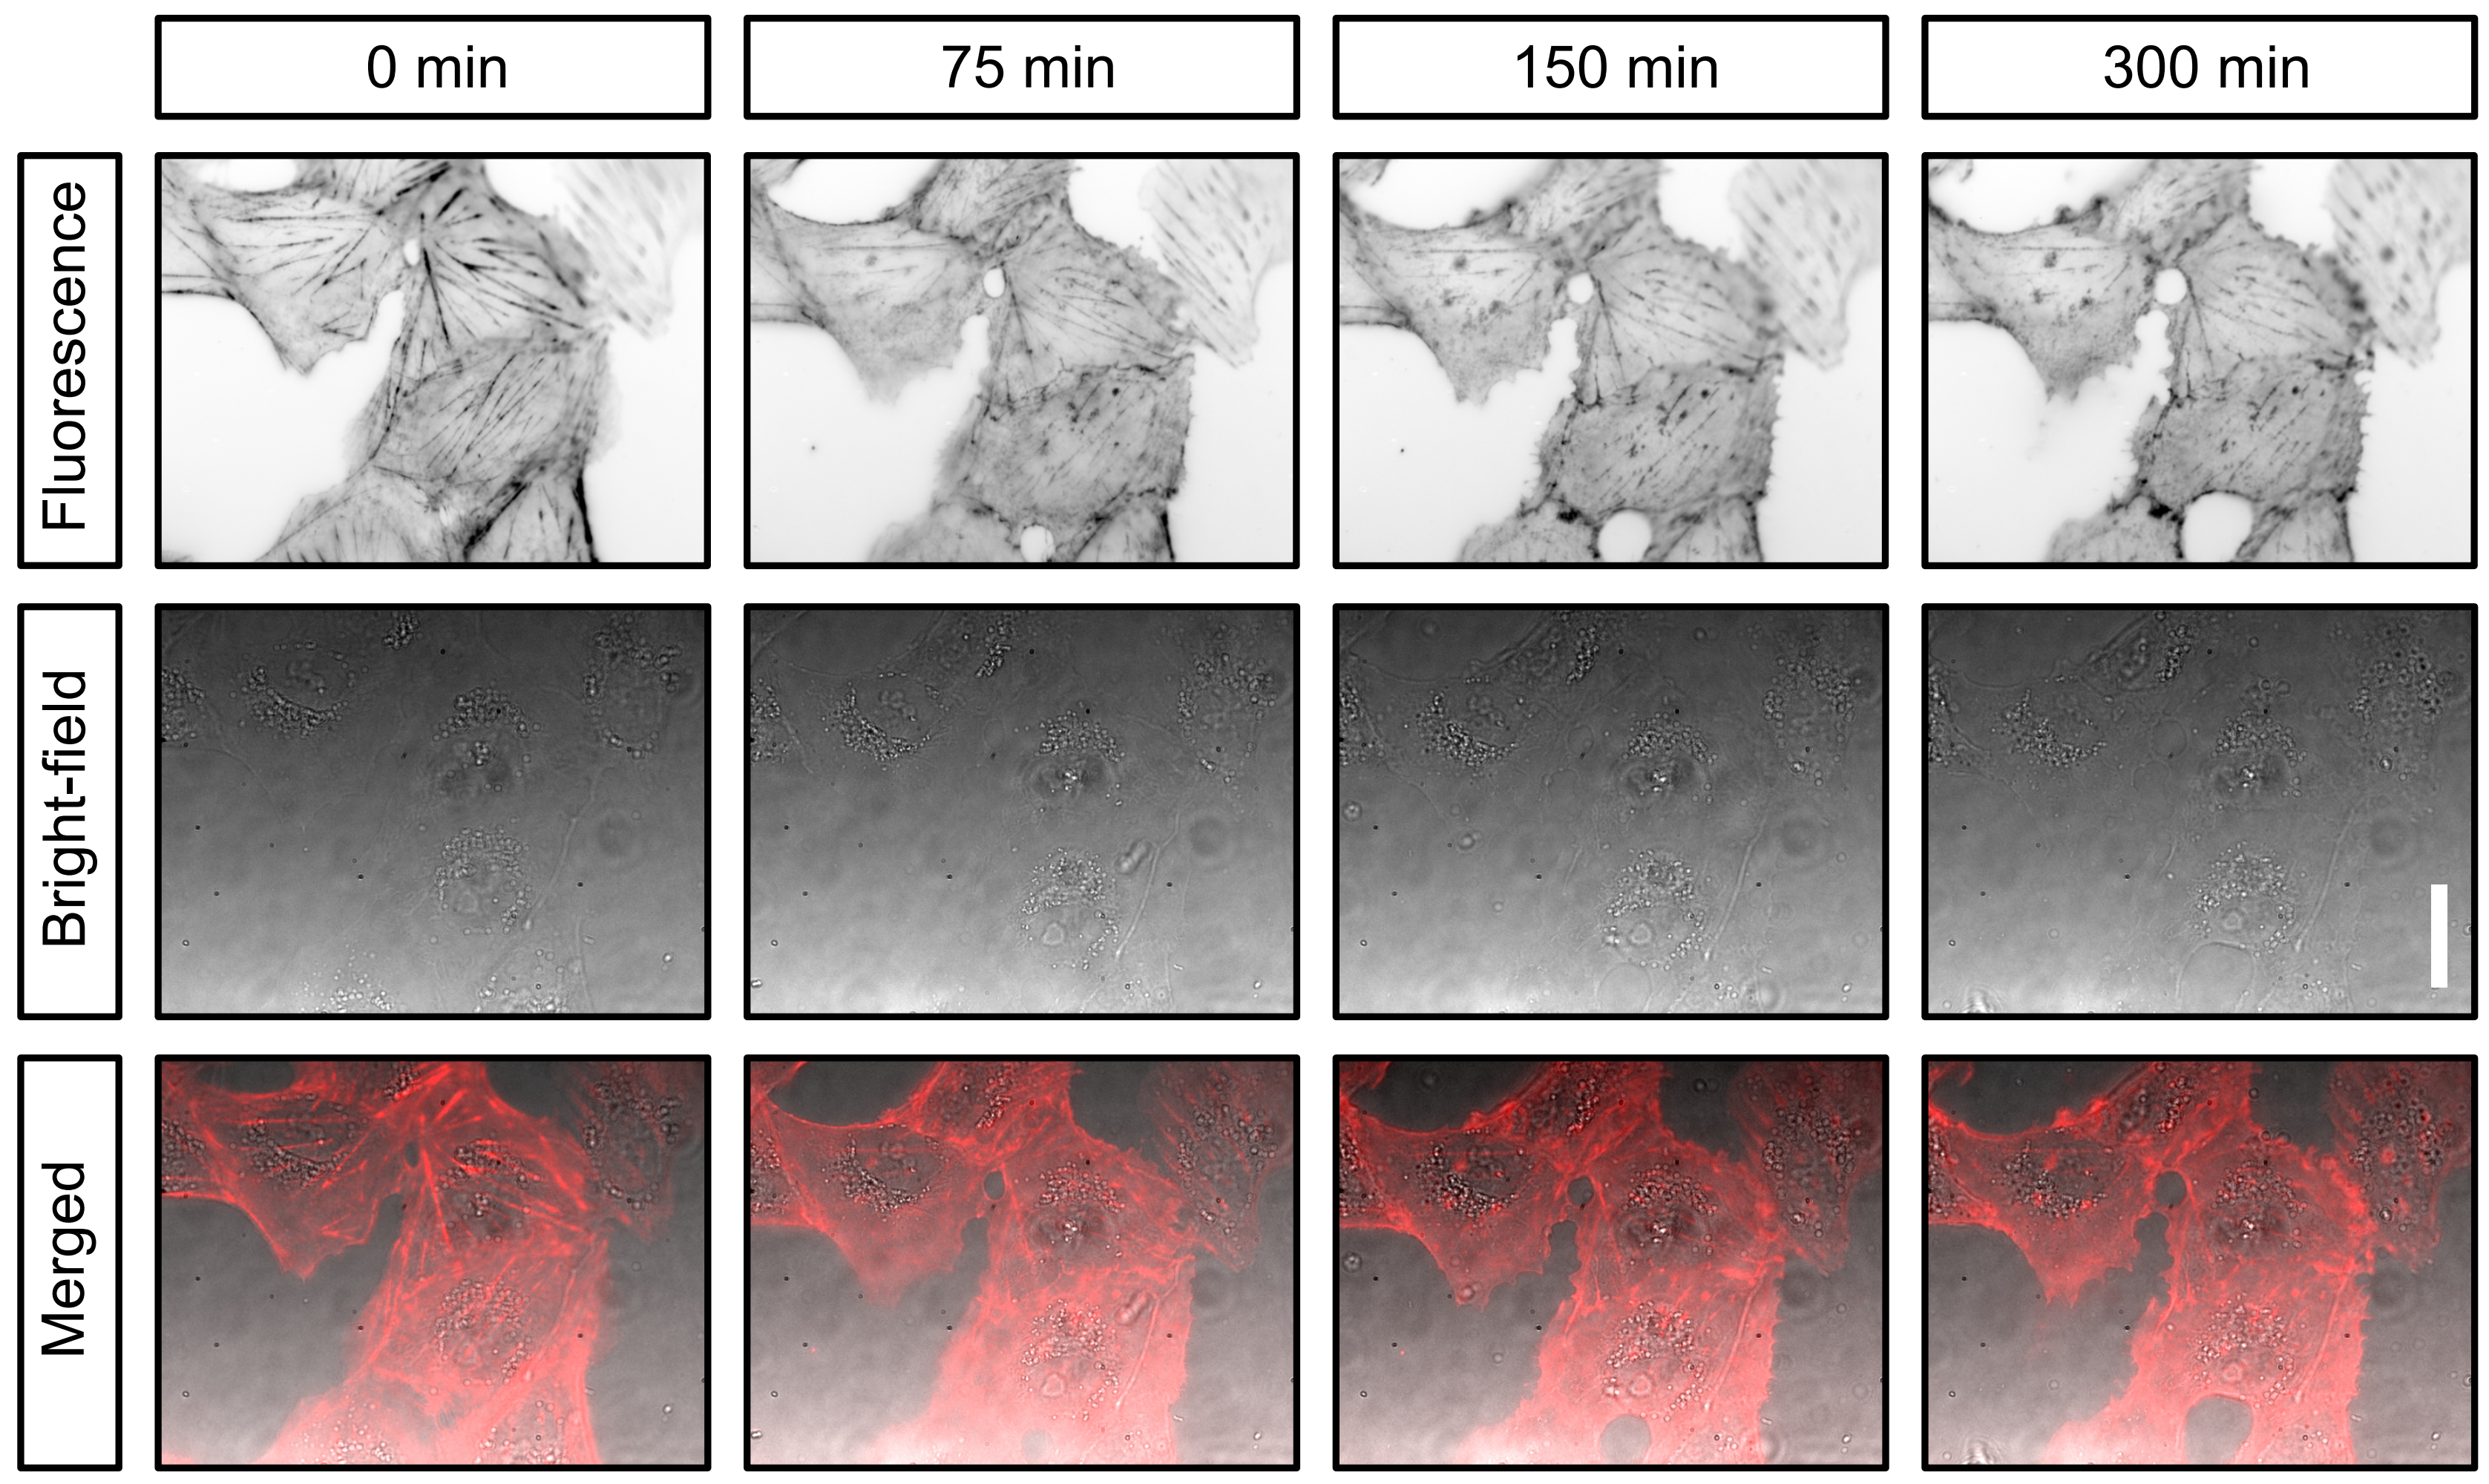
Live cell imaging of CV-1 cells stained with SiR actin over a period of five hours.
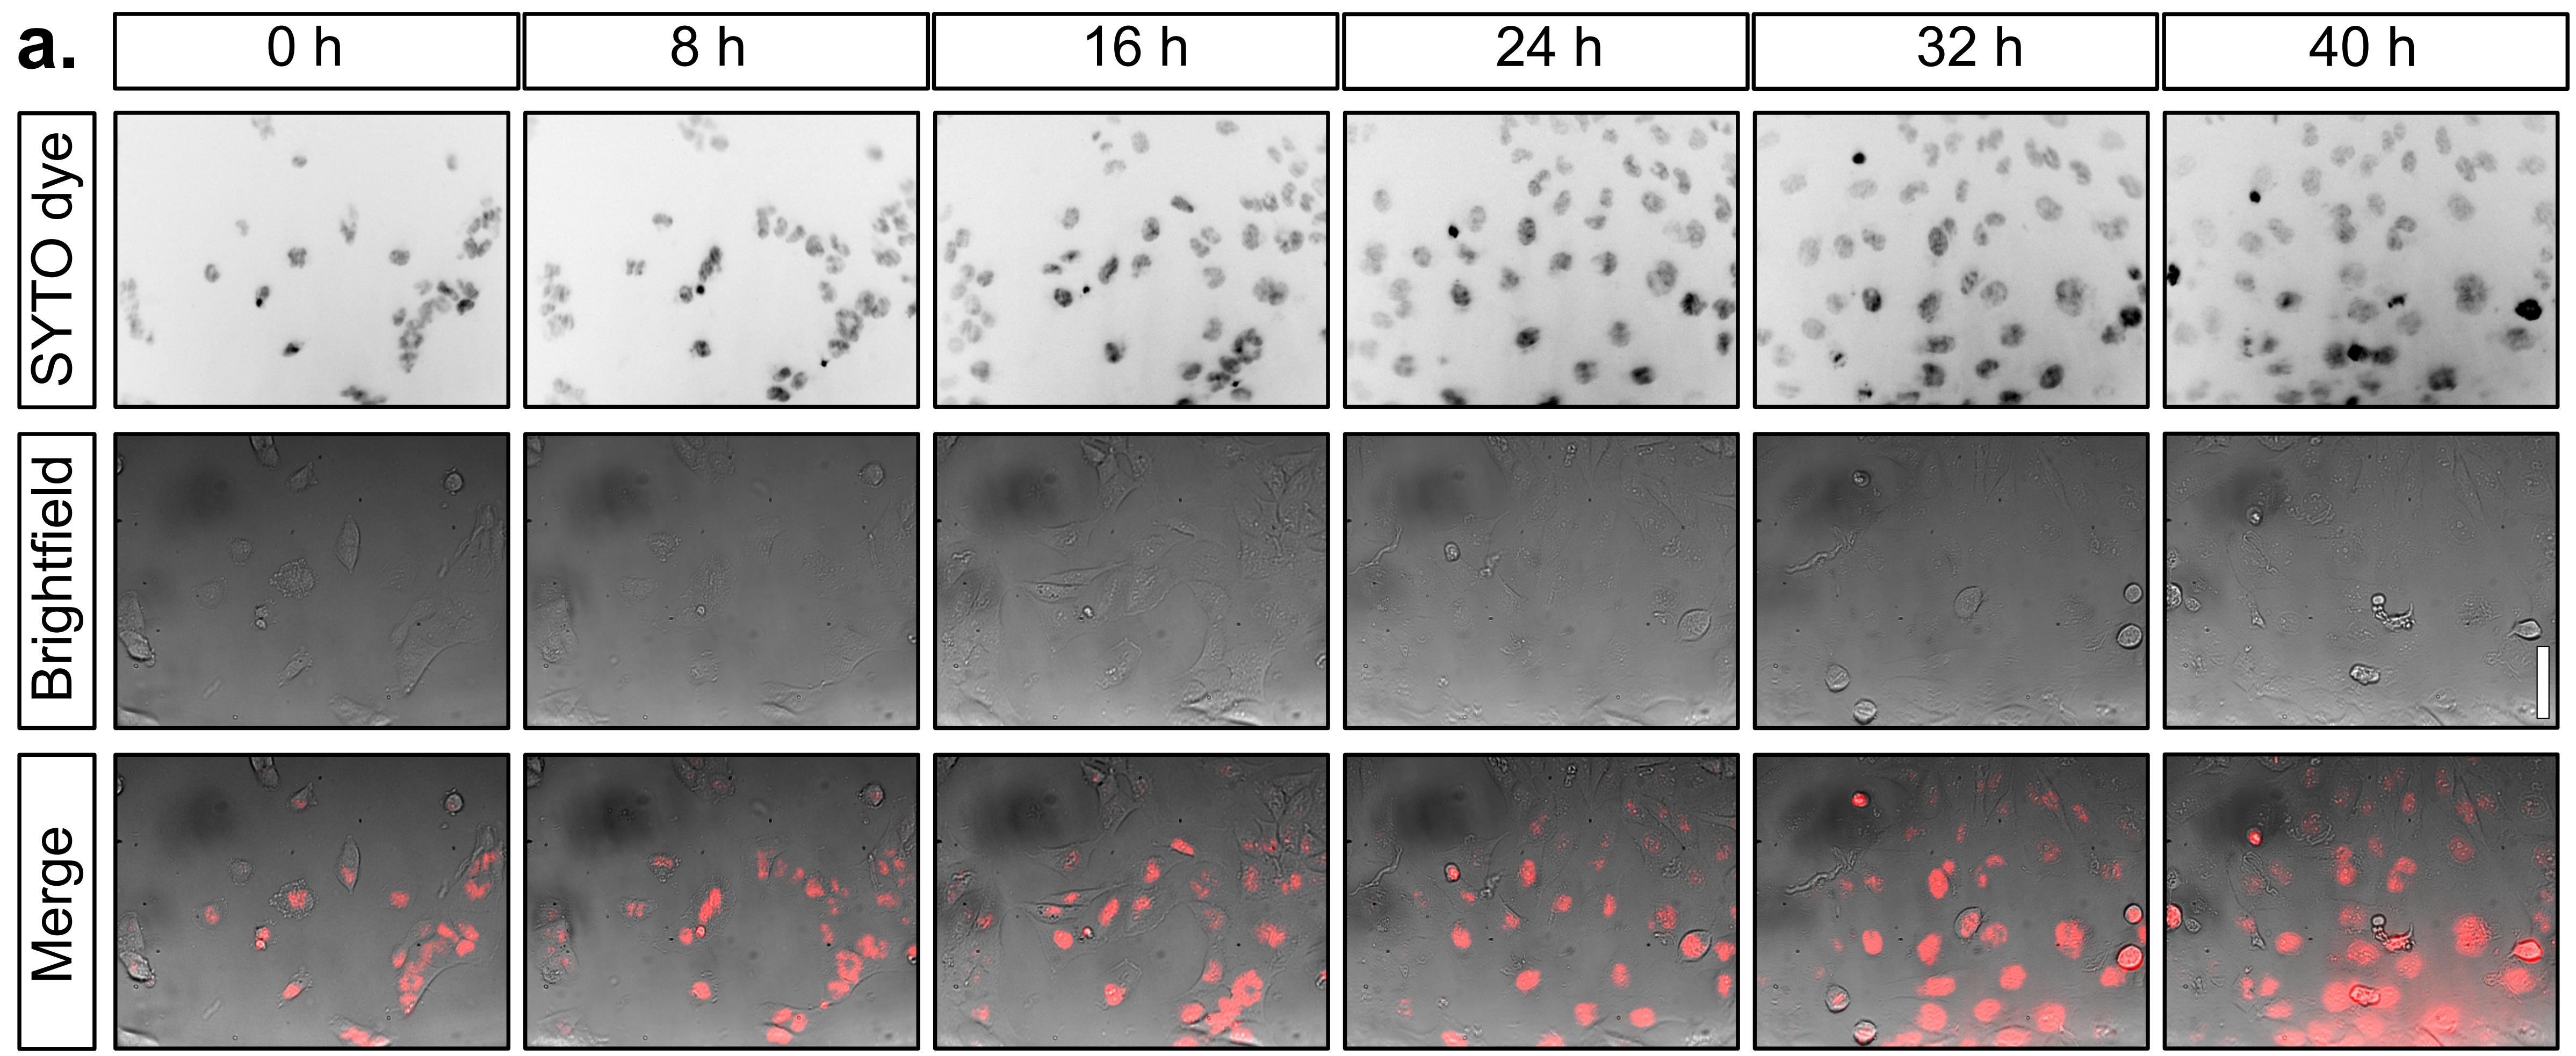
Live cell imaging of T98G cells stained with SYTO far red nucleic dye over a period of two days within an incubator.
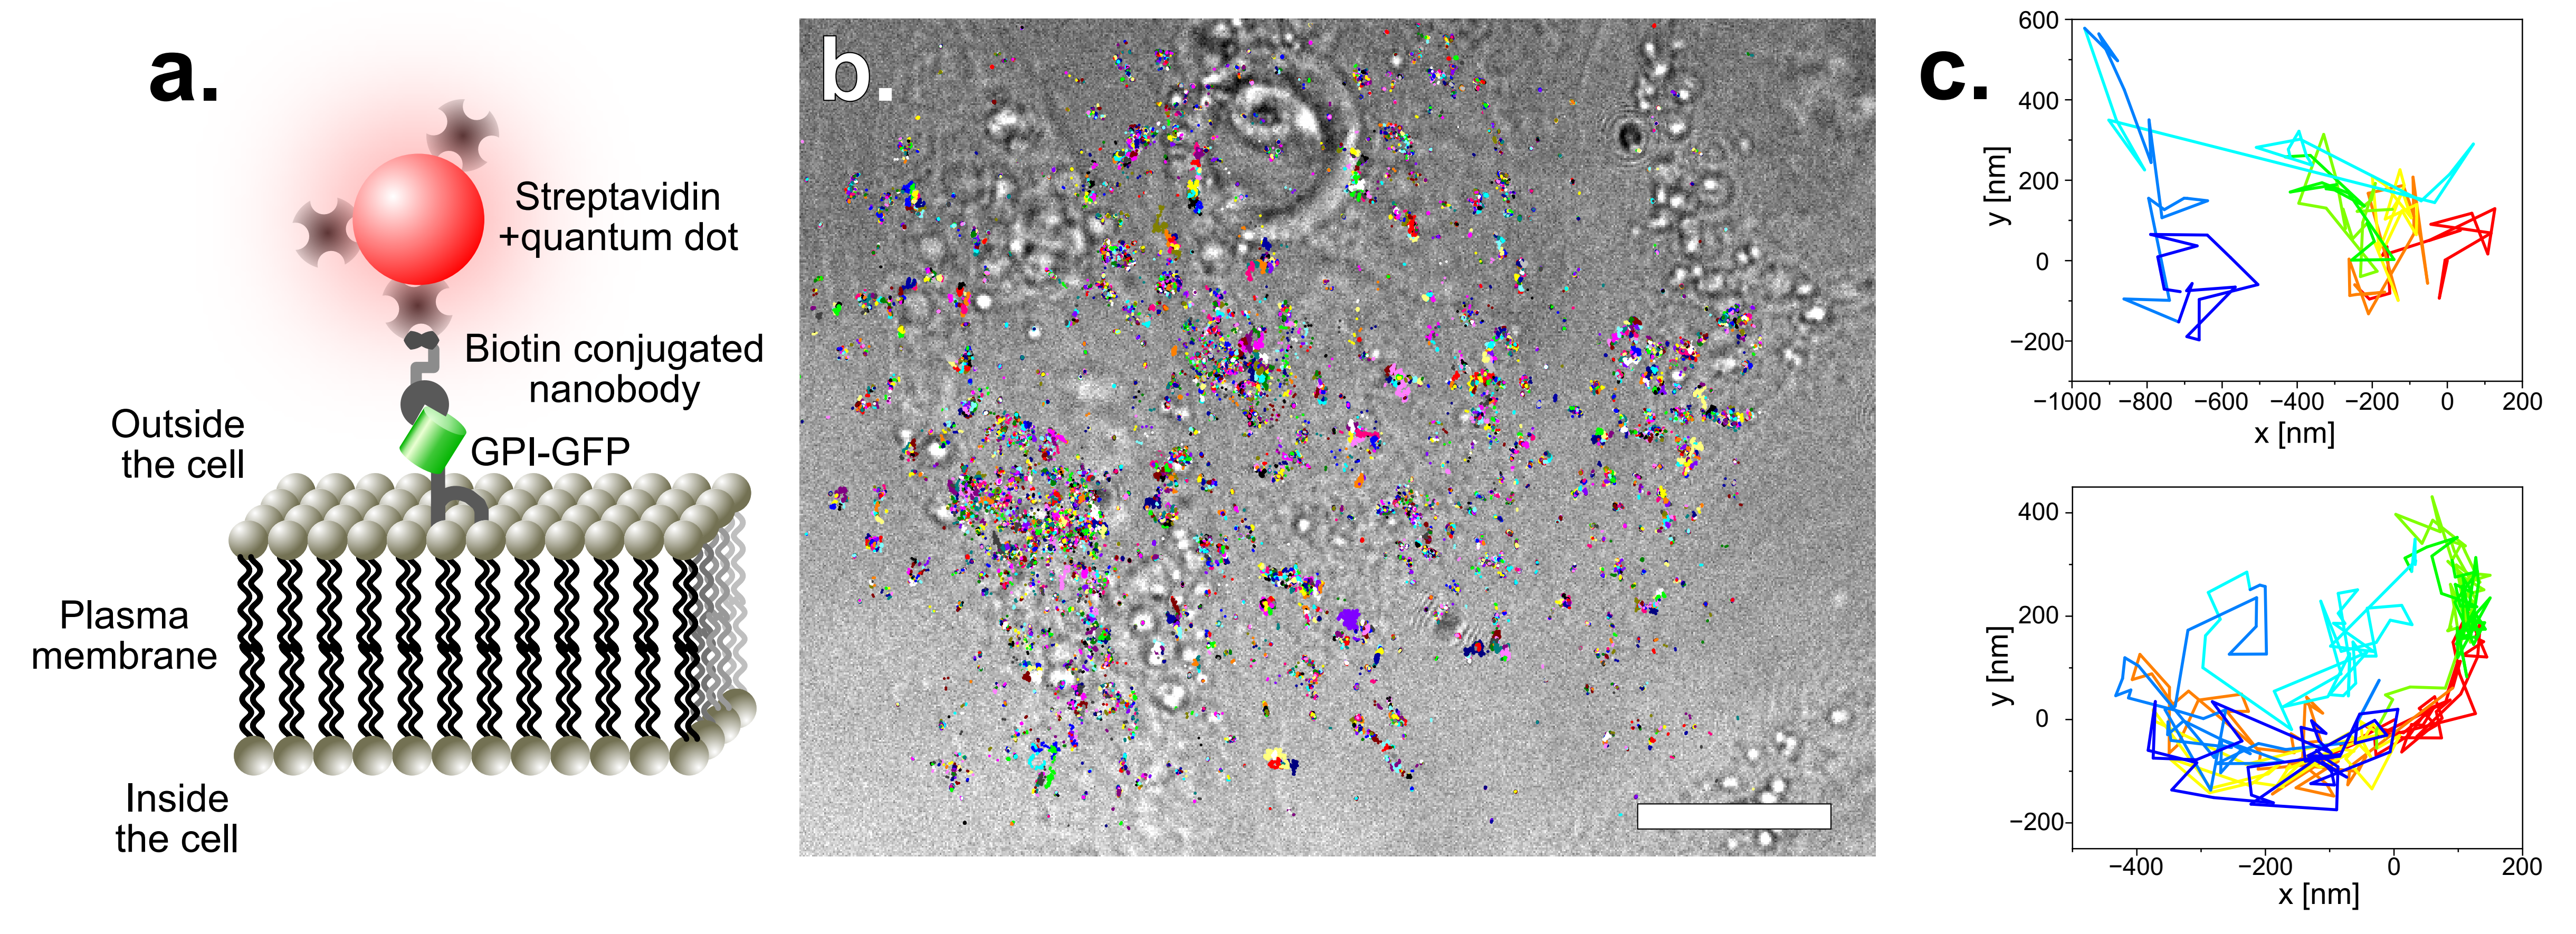
Single particle tracking of GPI-GFP on HeLa cells. For more photostability, the tracks are acquired by imaging quantum dots. These have been functionalized with straptavidin and are attached to GFP via biotin conjugated anti-GFP nanobodies. The construct is schematically disaplayed in a. The acquired tracks are overlayed on a bright-field image of the HeLa cells (b.) (scale bar represents 10 µm). Two single tracks are exeplarily displayed in c.
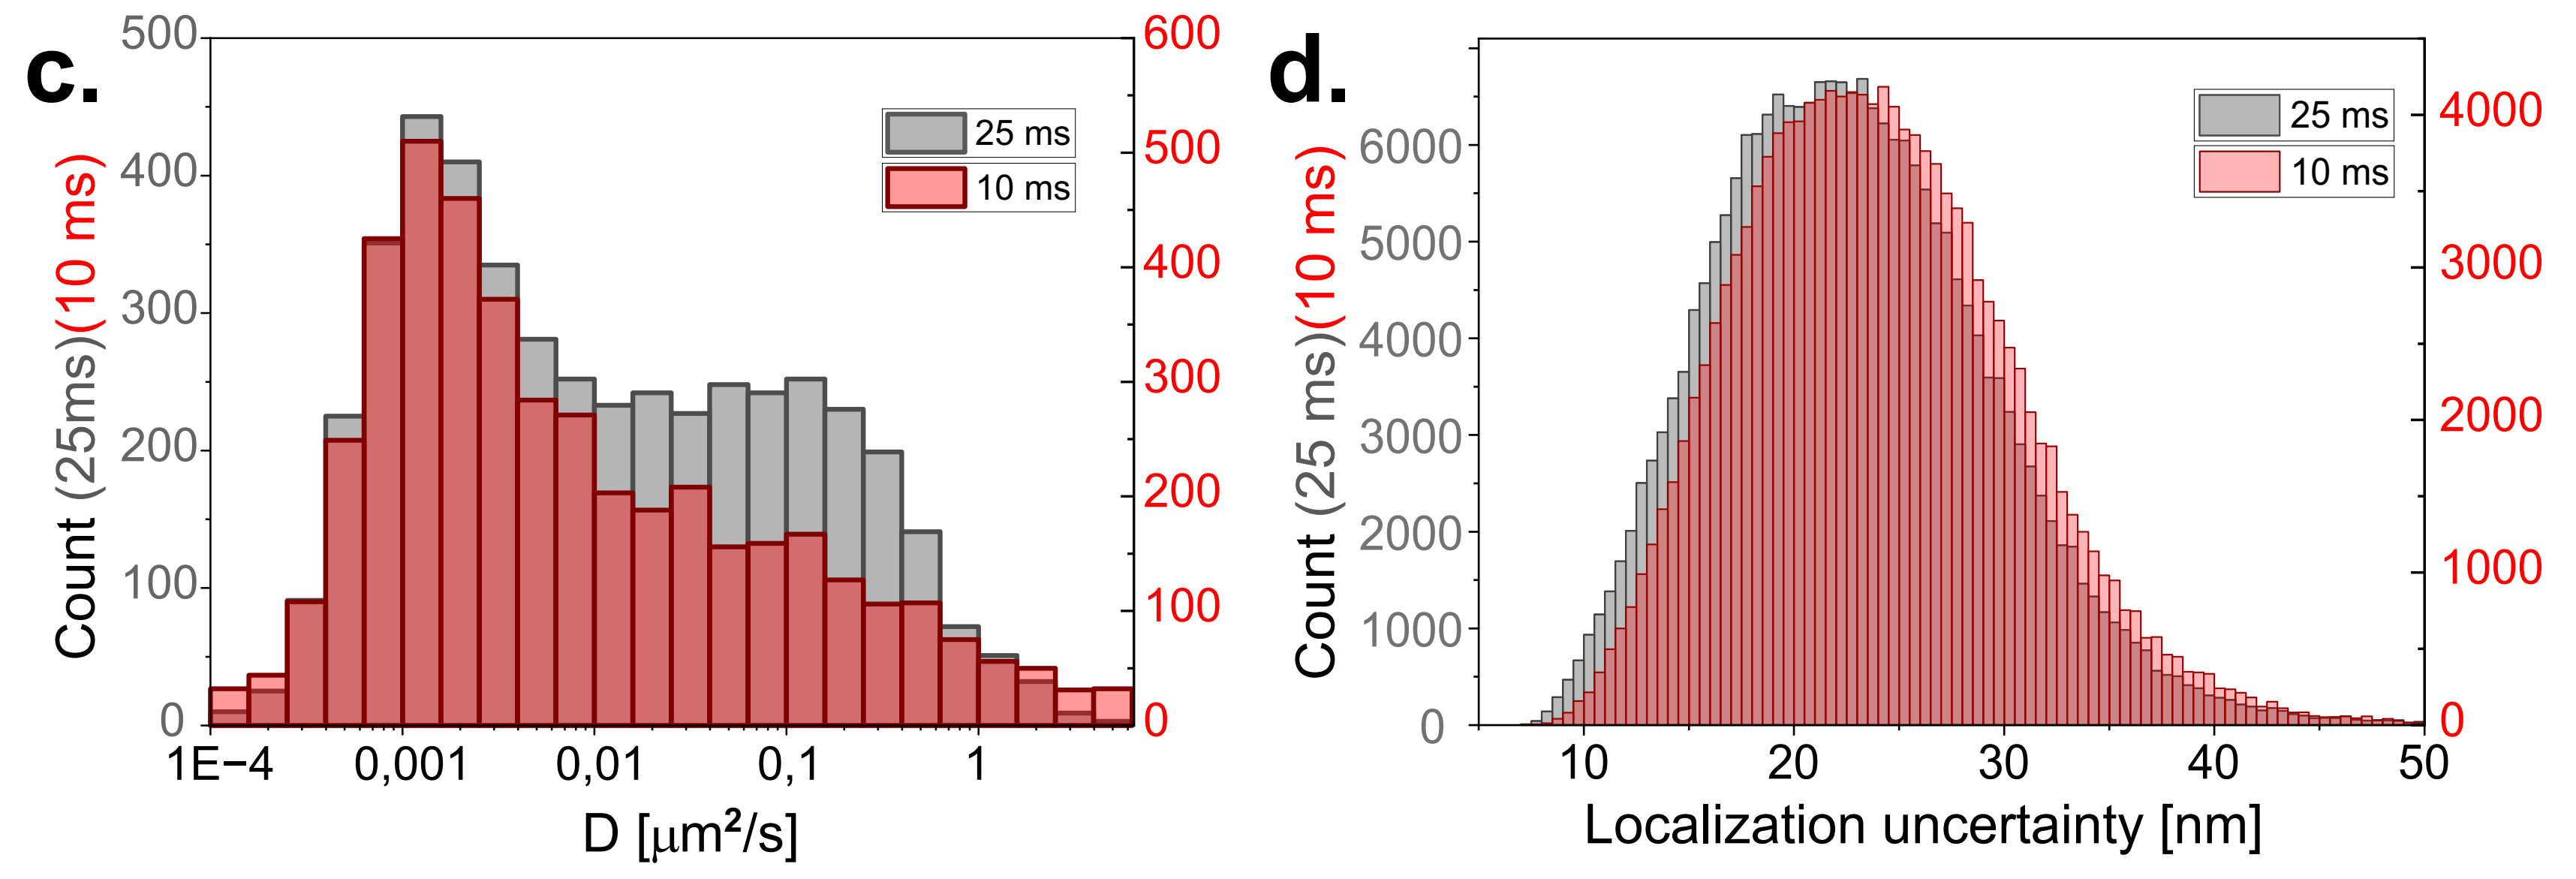
Diffusion coefficient of the tracked quantum dots with 10 and 25 ms exposure time of the camera. To have similar localization uncertainties, the laser power was doubled for the shorter exposure time. Two populations can be identified. The first one has a slower diffusion and corresponds to particles which are stuck or simply immobile. The other population which seems to have a maximum around and corresponds to the random diffusion of GPI on the cell membrane.
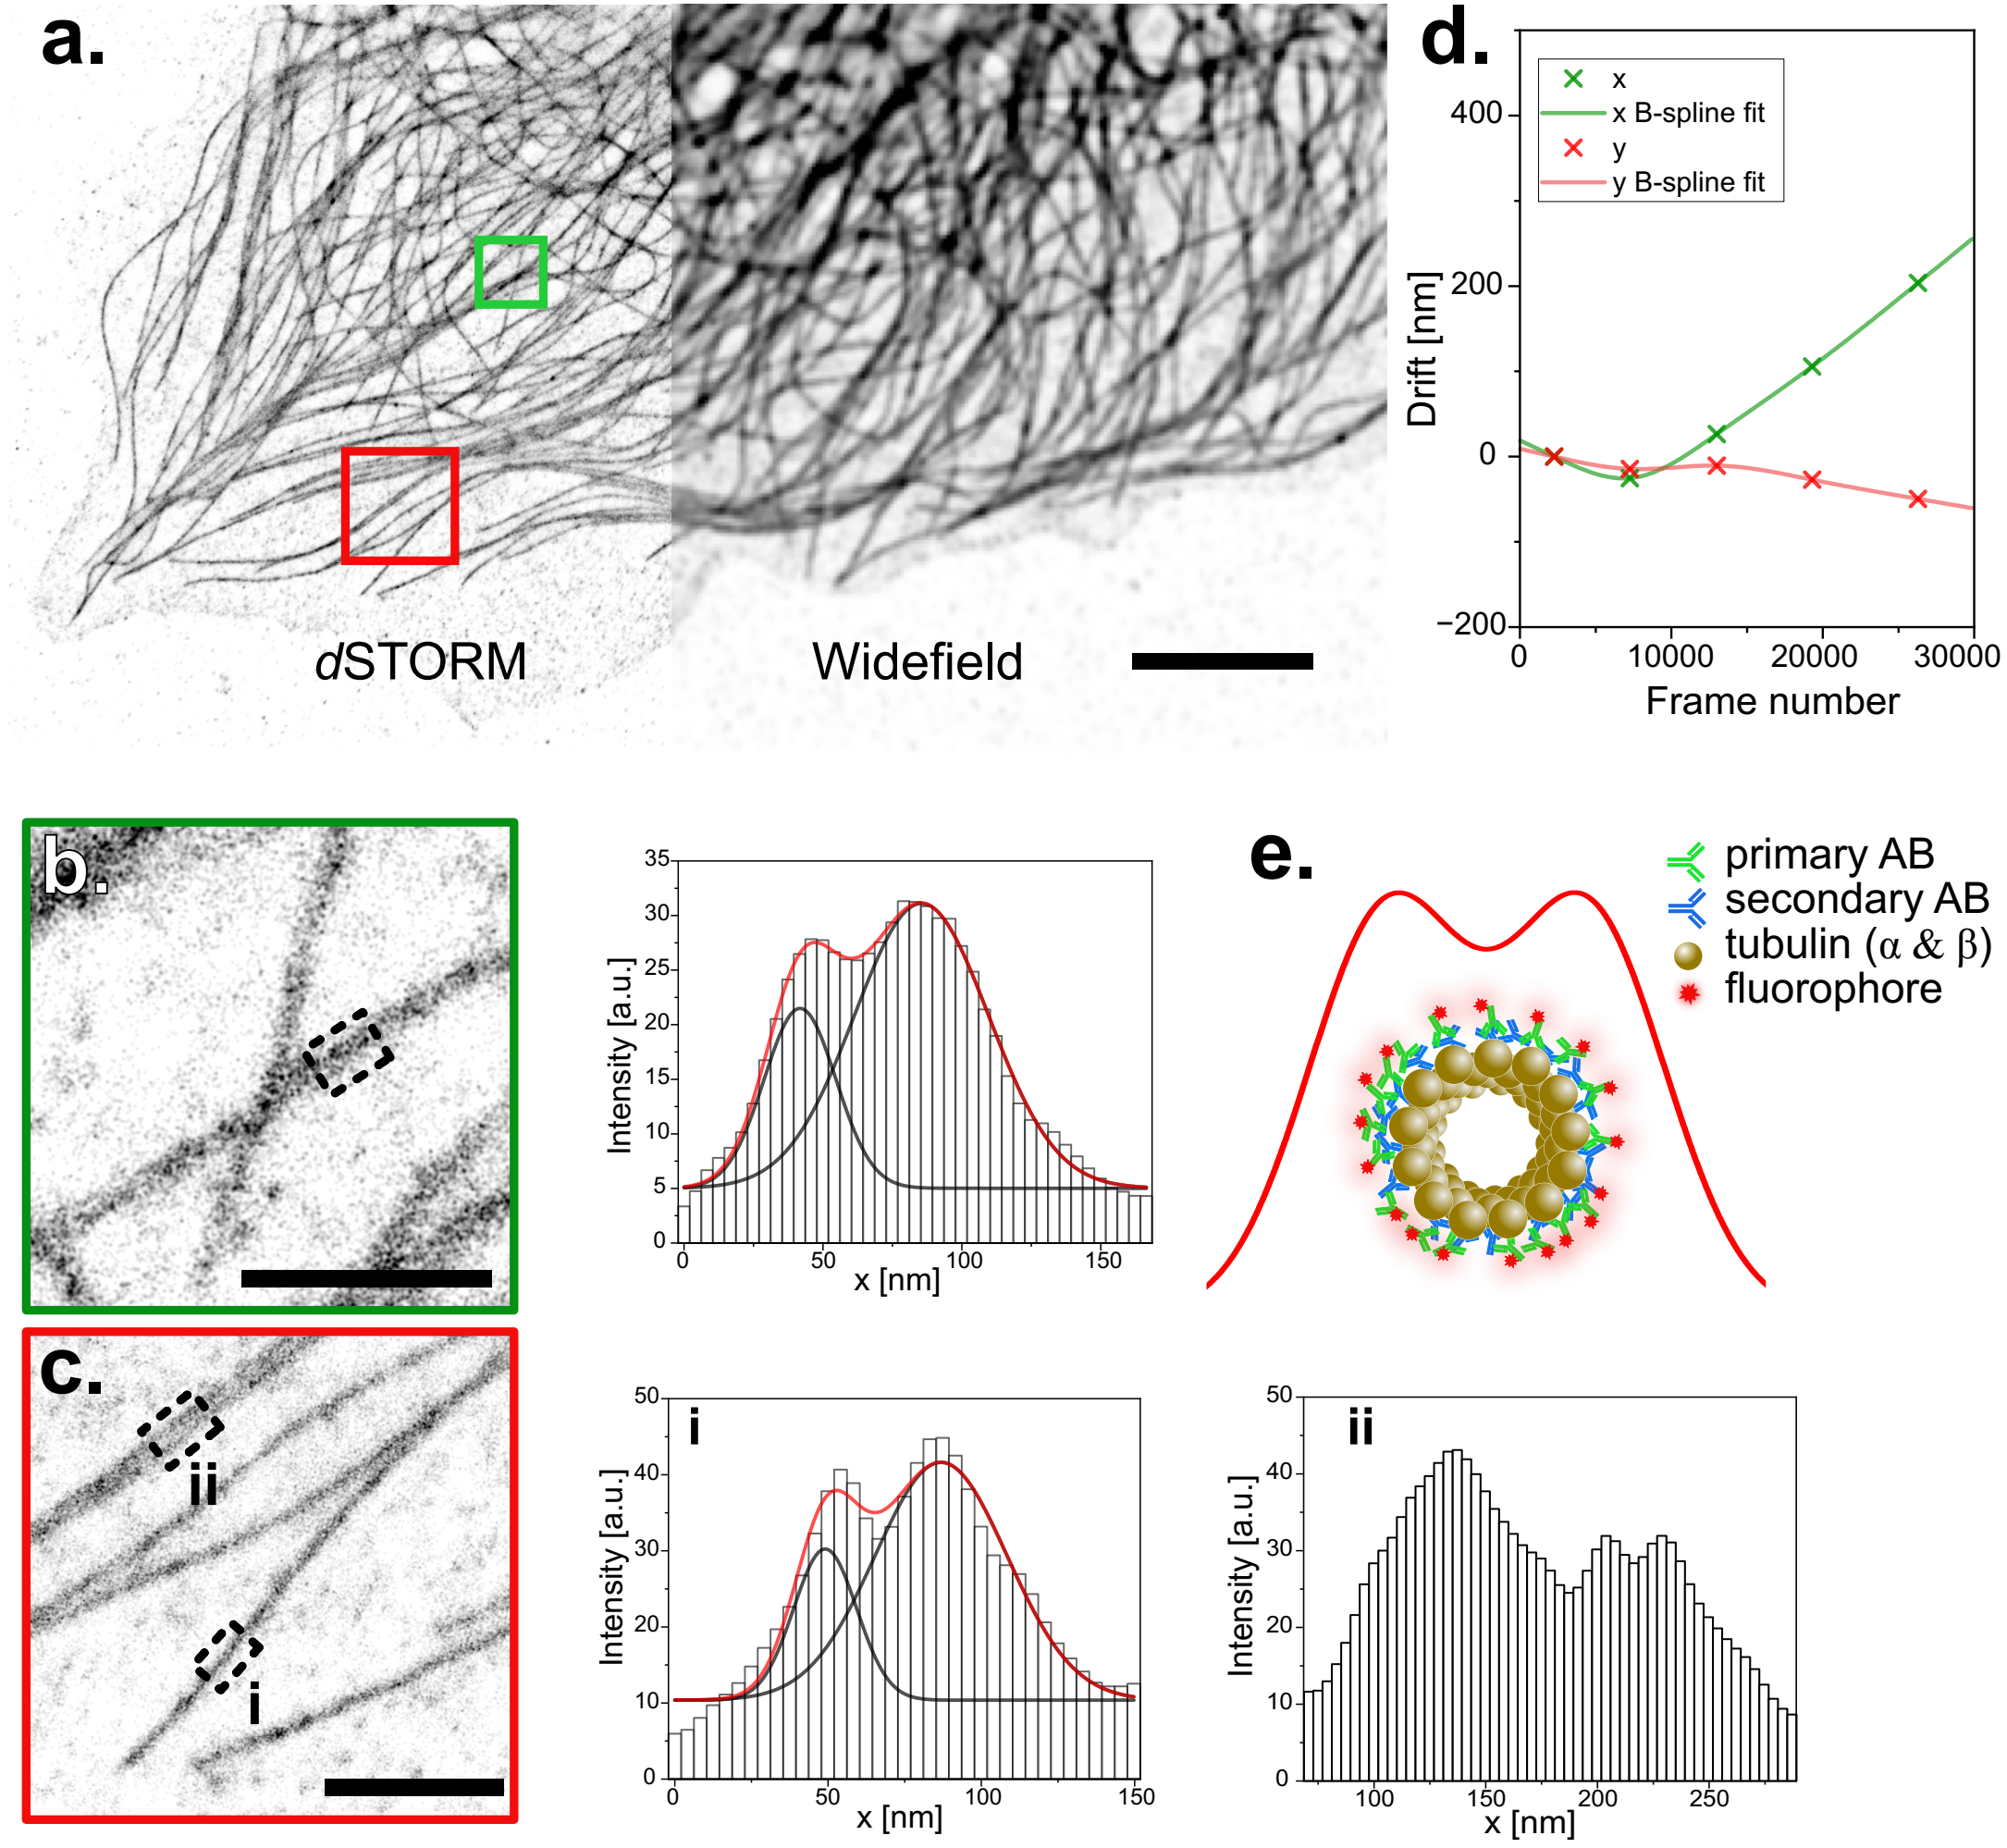
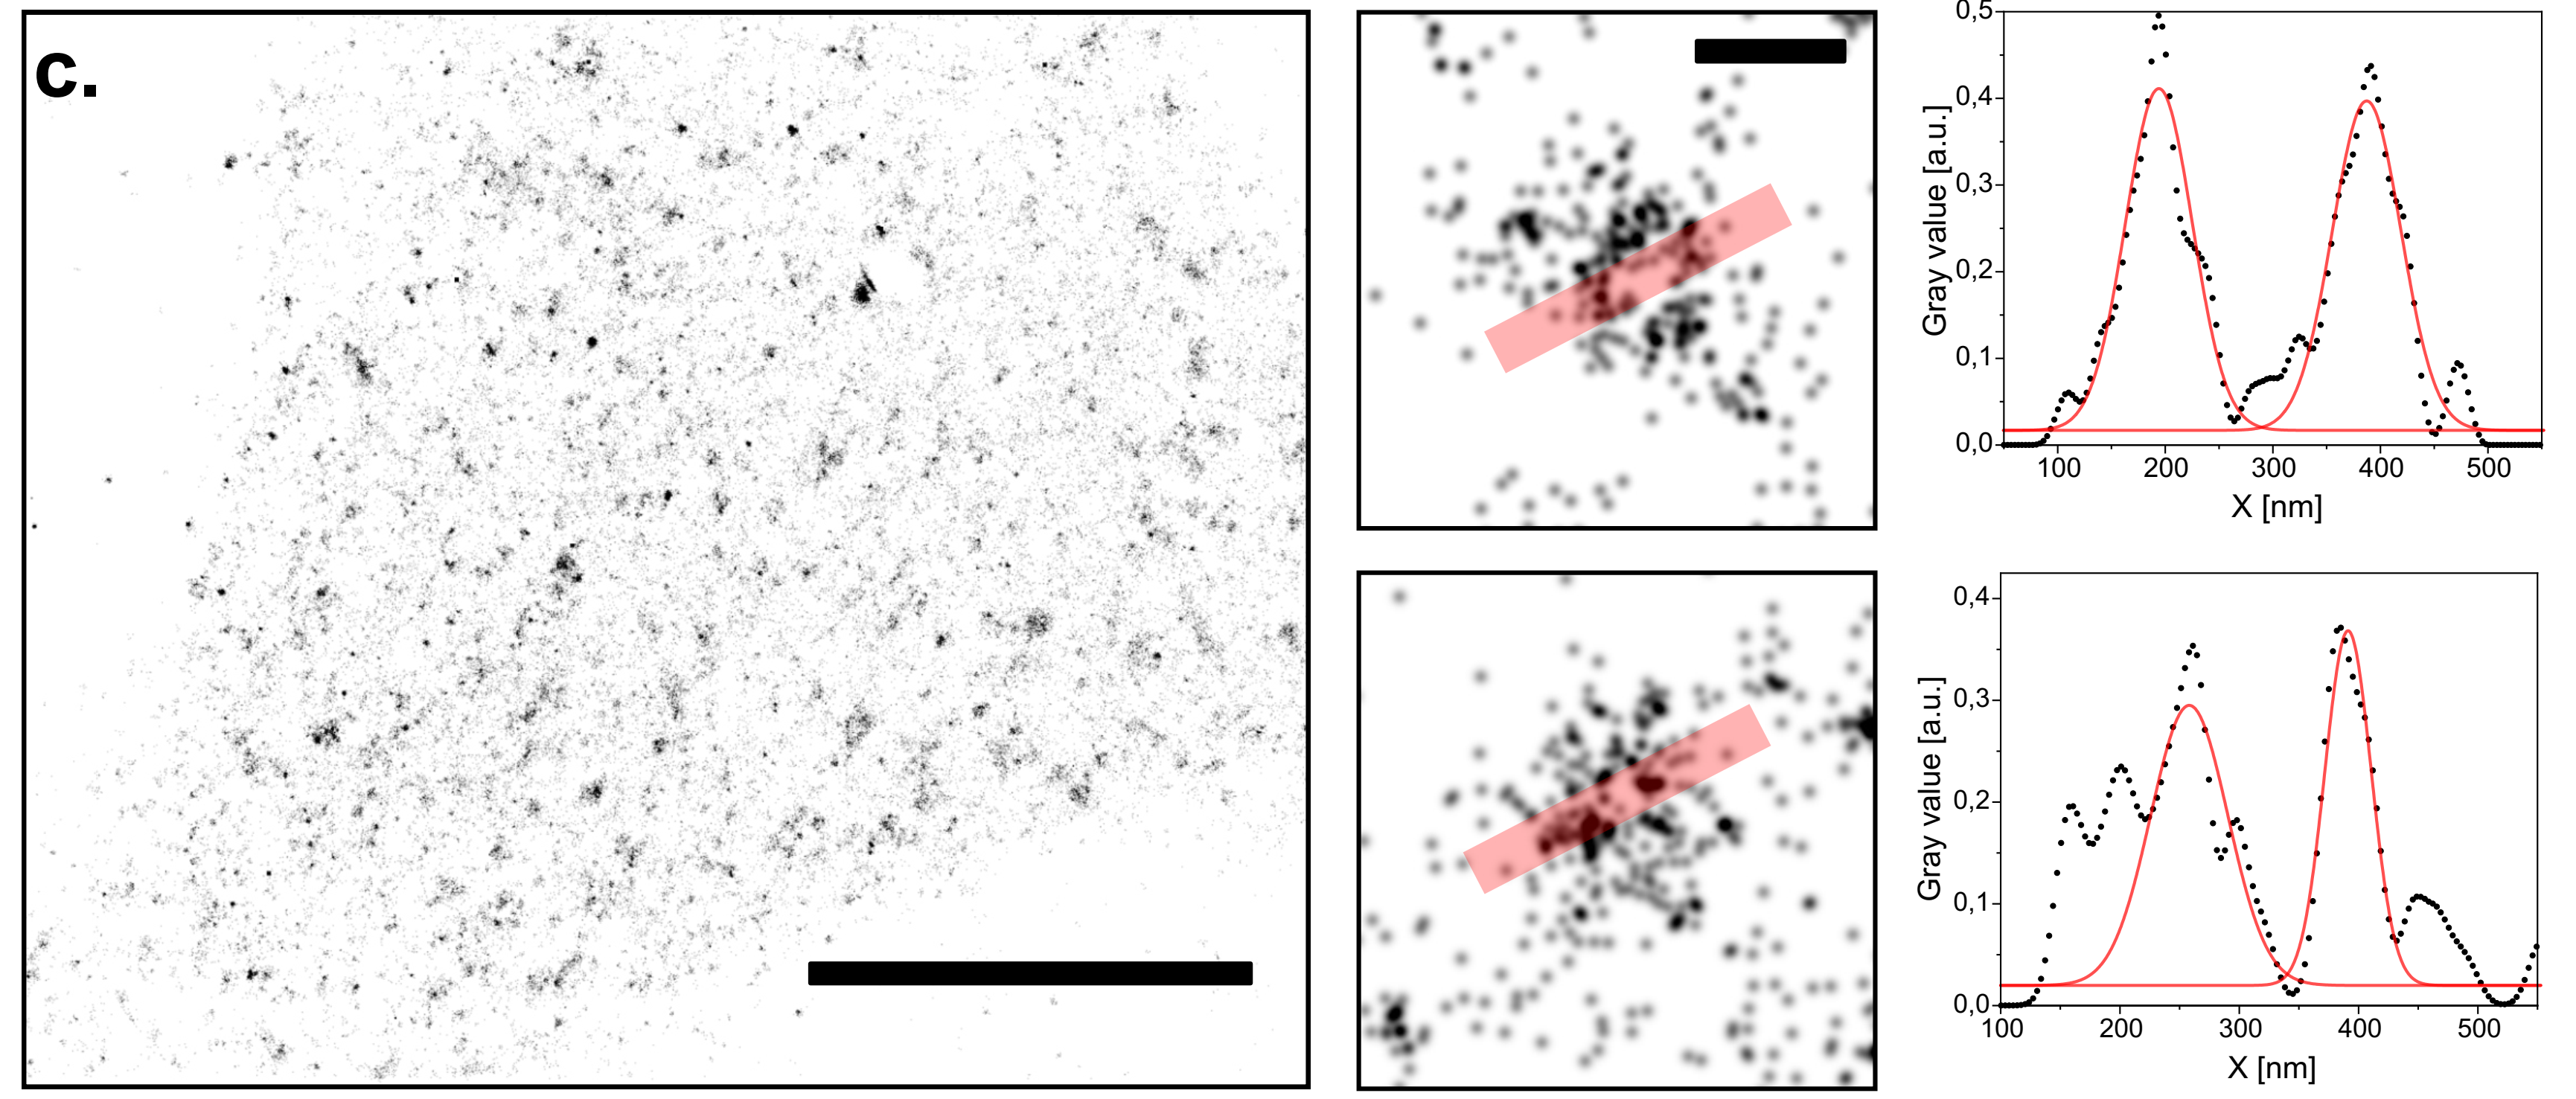
dSTORM image of microtubules reconstructed from wide-field images acquired on the UC2. a. Immuno-stained microtubules in CV-1 cells are shown in wide-field and with dSTORM. Scale bar represents 5 µm. b. and c. show the averaged profiles along 200 nm of microtubules within two regions of interest. Profiles are fitted with a double Gaussian. Peak to peak distances of (38±2) nm for b and (43±2) nm for c.i are extrapolated. Scale bar represents 1 µm in the magnified ROIs. d. Drift measured by cross-correlation during the raw-data acquisition period of the reconstructed image displayed in a. e. Simplified schematic of the front view of a microtubule sample after immuno-staining and the resulting railroad tracks.
Imaging with lower-budget objectives
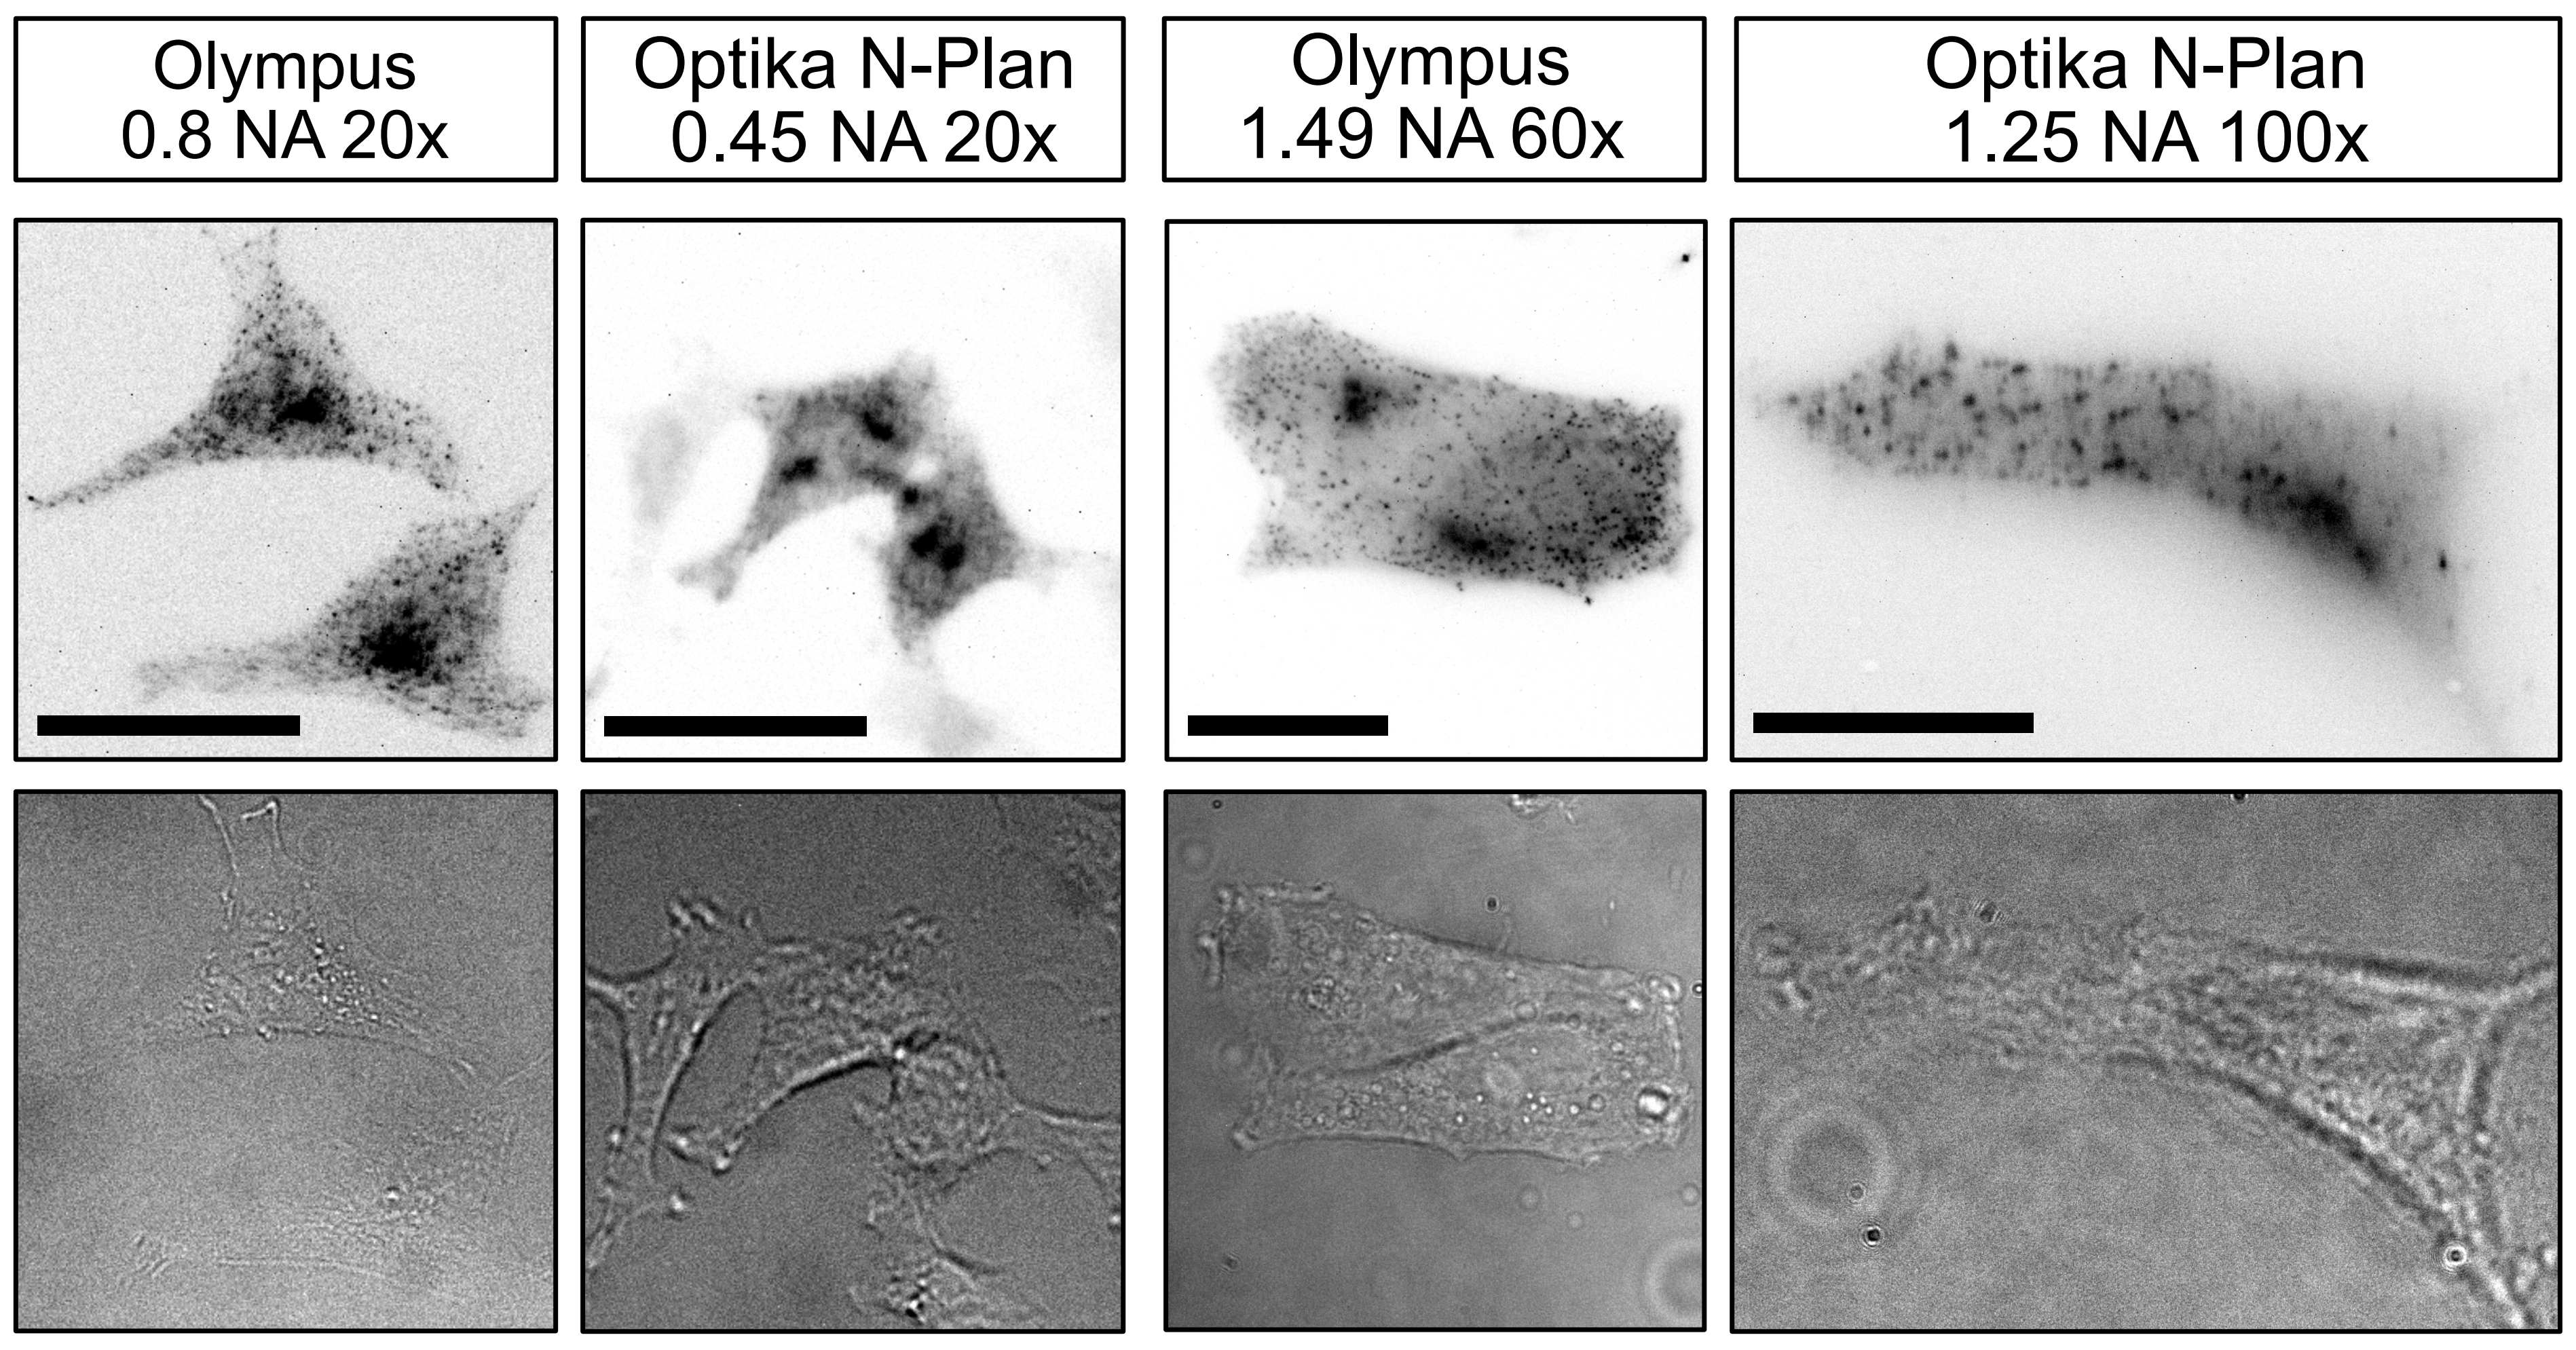
Stable HeLa cell-line with Clathrin light chain-GFP stained with AF647 conjugated anti-GFP nanobodies, in the fluorescence as well as the brightfield channel. Images have been acquired with the different objectives listed in the top of the image. The scale bars in the 20 ×, 60 × and 100 × magnified images respectively represent 30 µm.
Single molecule localization microscopy (dSTORM) on the UC2 setup with a low-budget objective. Reconstruction of CLC-GFP in HeLa cells immuno-stained with AF647 conjugated nanobodies. Scale bar for represents 10 µm. Two CCPs have been zoomed in to plot the profiles along the red transparent line. Scale bar for the magnified regions of interest represents 200 nm.