openUC2 Spectrometer
Welcome to the openUC2 Spectrometer repository. This guide will assist you in constructing and setting up a simple spectrometer, a fundamental tool in the field of spectroscopy.
Bill of Material
The following table lists all components needed to assemble the spectrometer, including 3D printing files. For 3D printing, we recommend using a Prusa i3 MK3 with PLA Prusament (Galaxy Black), at specified layer height and infill settings.
| Component | Description | Price | Download Link |
|---|---|---|---|
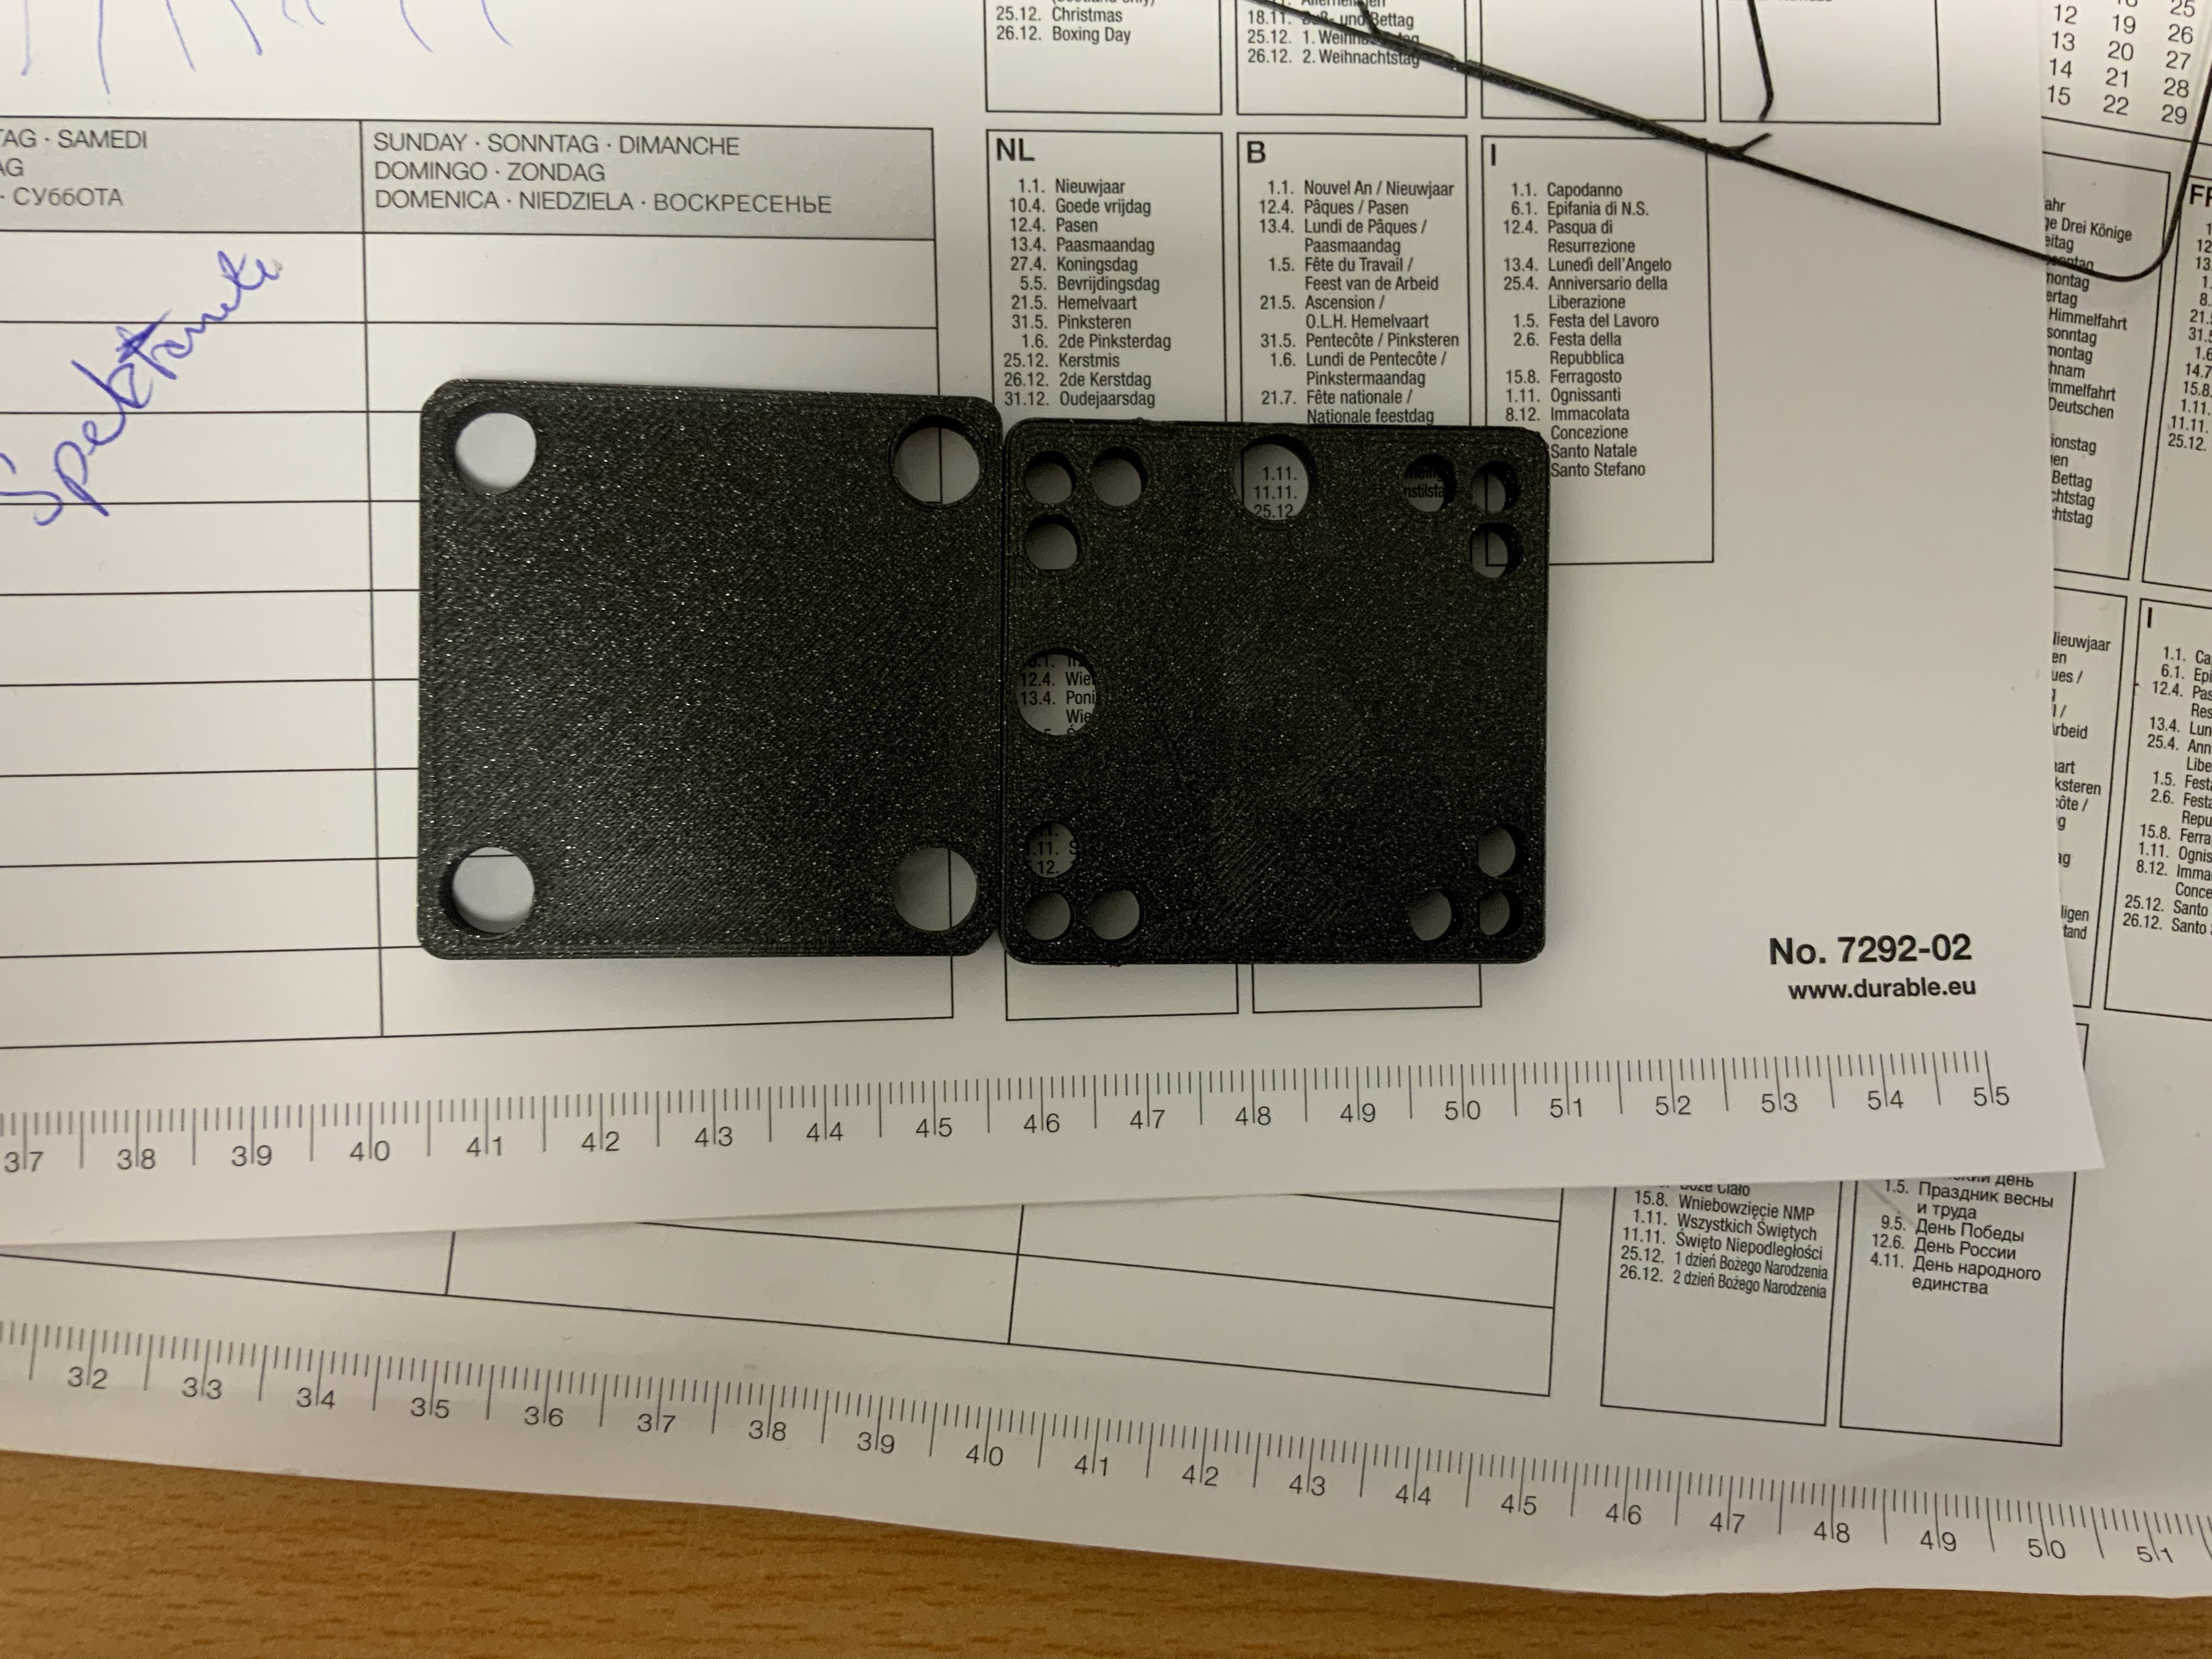
| Holder | Supports various parts of the spectrometer | x,xx € | Part.stl |
Theoretical Background: Spectroscopy
Spectroscopy is the scientific study of the interaction between light and matter. It involves analyzing how light is absorbed, emitted, or scattered by different materials. This field is pivotal in understanding the properties of both light and matter.
Key Concepts in Spectroscopy:
- Visible Spectrum: The portion of the electromagnetic spectrum visible to the human eye, ranging from approximately 400 nm (violet) to 800 nm (red-violet).
- Absorption and Emission: Spectroscopy investigates how substances absorb or emit energy in the form of light or electromagnetic waves.
- Spectrum Analysis: The process of breaking down light into its constituent wavelengths.
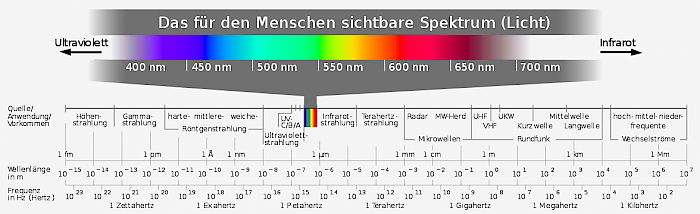 Fig 1.: Visible Spectrum
Understanding Light
Light, in the context of spectroscopy, refers to electromagnetic radiation within the visible range of the human eye.
- Wavelengths: Visible light comprises wavelengths from about 400 nm (violet) to 800 nm (red).
- Color Perception: The color we perceive is a function of the wavelength of light.
- Electromagnetic Spectrum: Visible light is a part of a broader spectrum, including ultraviolet (UV) and infrared (IR) light.
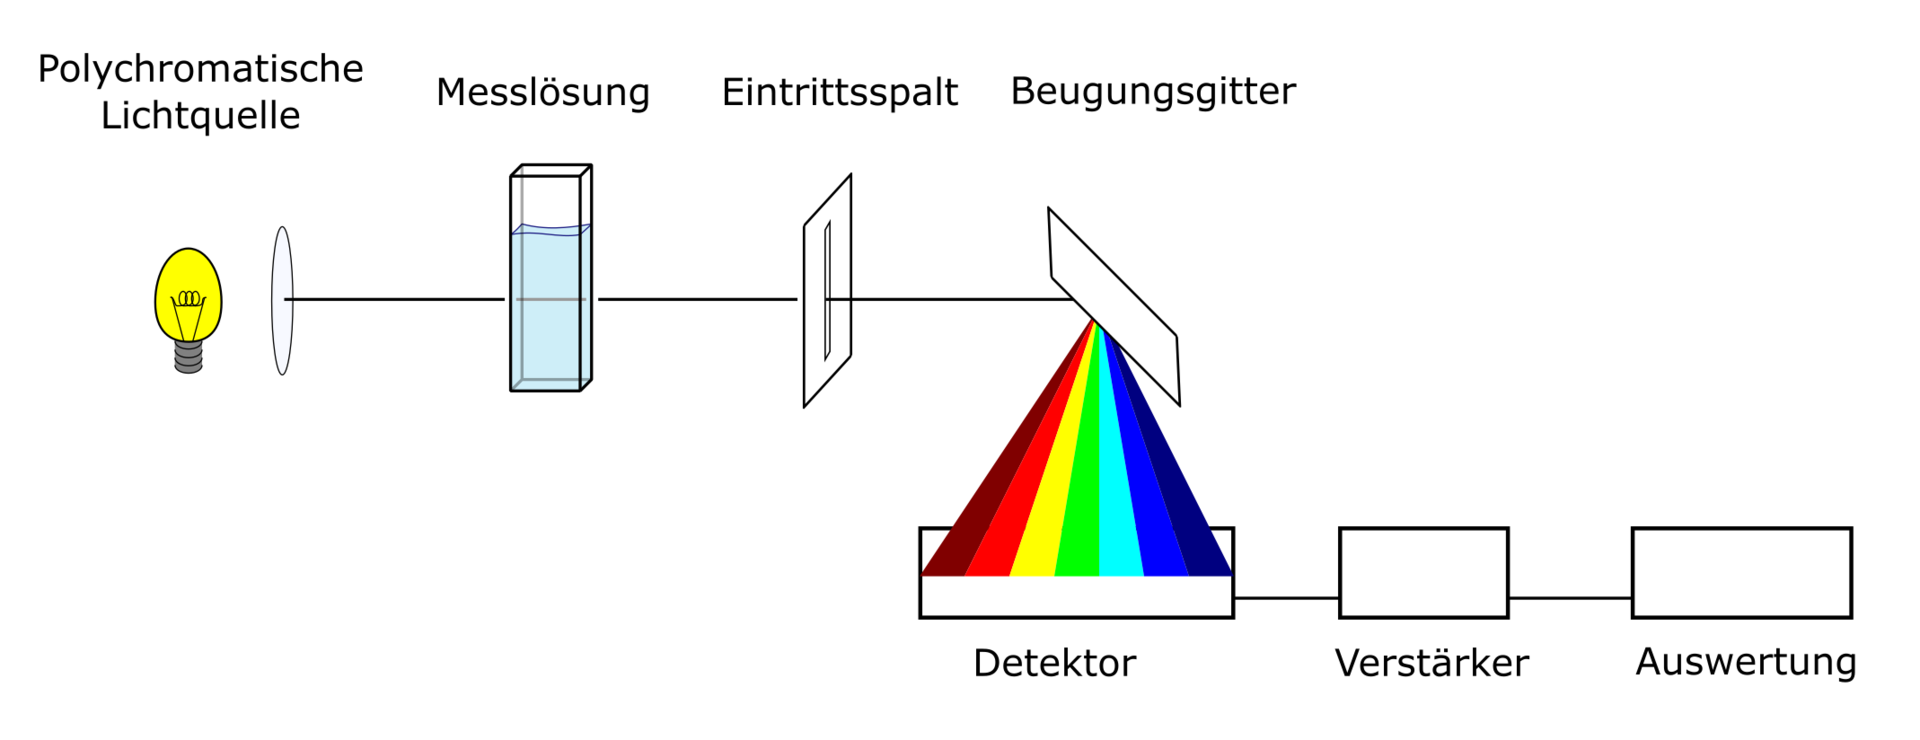 Fig 3: Absorption Spectroscopy
Matter and Its Interaction with Light
Matter, whether in a gaseous, liquid, or solid state, interacts with radiation in various ways—absorption, transmission, or reflection.
Oscillation in Light
- Sinusoidal Oscillation: Light waves exhibit a sinusoidal or harmonic oscillation.
- Perception of Colors: Our eyes perceive different wavelengths as different colors, with the combination of all wavelengths appearing white.
 Fig 2: Light-wave as a sine wave
Spectrometer Overview
A spectrometer is an instrument used to measure the spectrum of light.
Components of a Spectrometer:
- Light Source: Provides the initial light for analysis.
- Monochromator: Separates light into its component wavelengths.
- Sample Holder: Holds the sample being analyzed.
- Detector: Captures and measures the light spectrum.
Construction and Grating Order
- Diffraction Grating: A key component, often made from materials like a blank DVD.
- Grating Order: Refers to the directions in which light is diffracted.
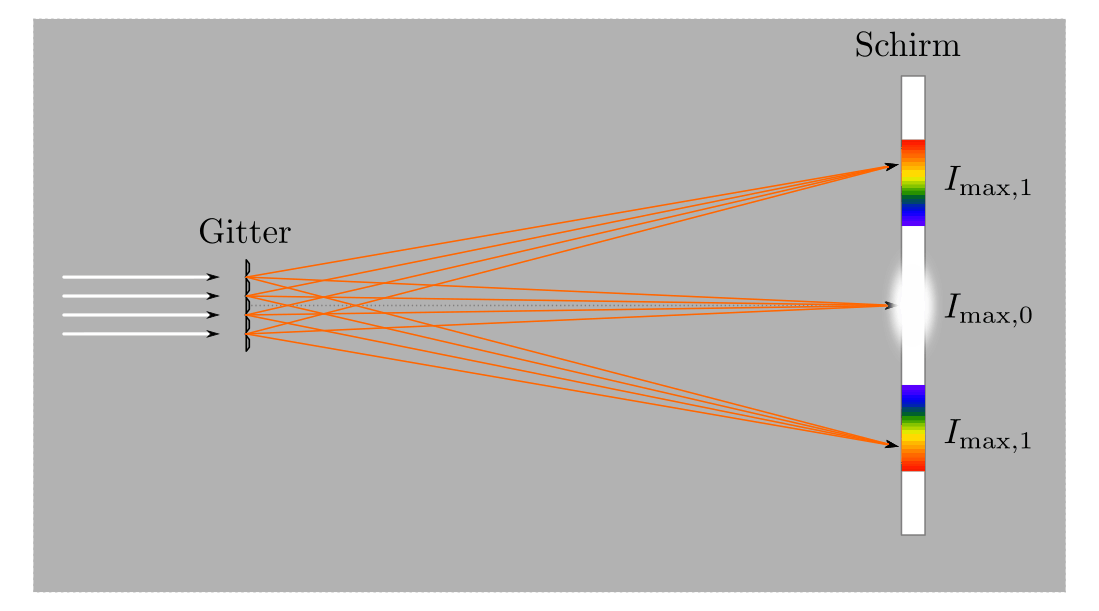 Fig 4: Diffraction at a grating
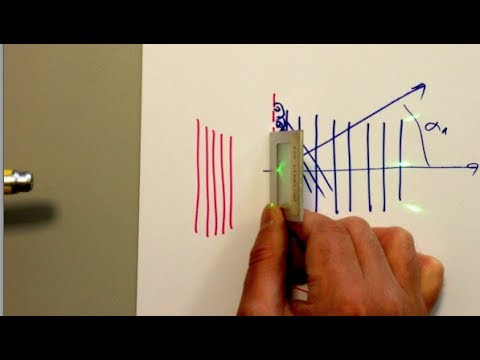 Fig 5: Diffraction at a grating with a real grating
Building a Spectrometer with 3D Printing
Necessary Components:
- Light source (e.g., torch)
- Slit
- Lens
- Grating
- Camera with lens
Assembly Instructions
Detailed step-by-step instructions are provided for assembling the spectrometer, including the use of 3D printed parts, magnets, and screws.
Assembly Steps with IMAGES/UC2-Spectrometer/IMAGES
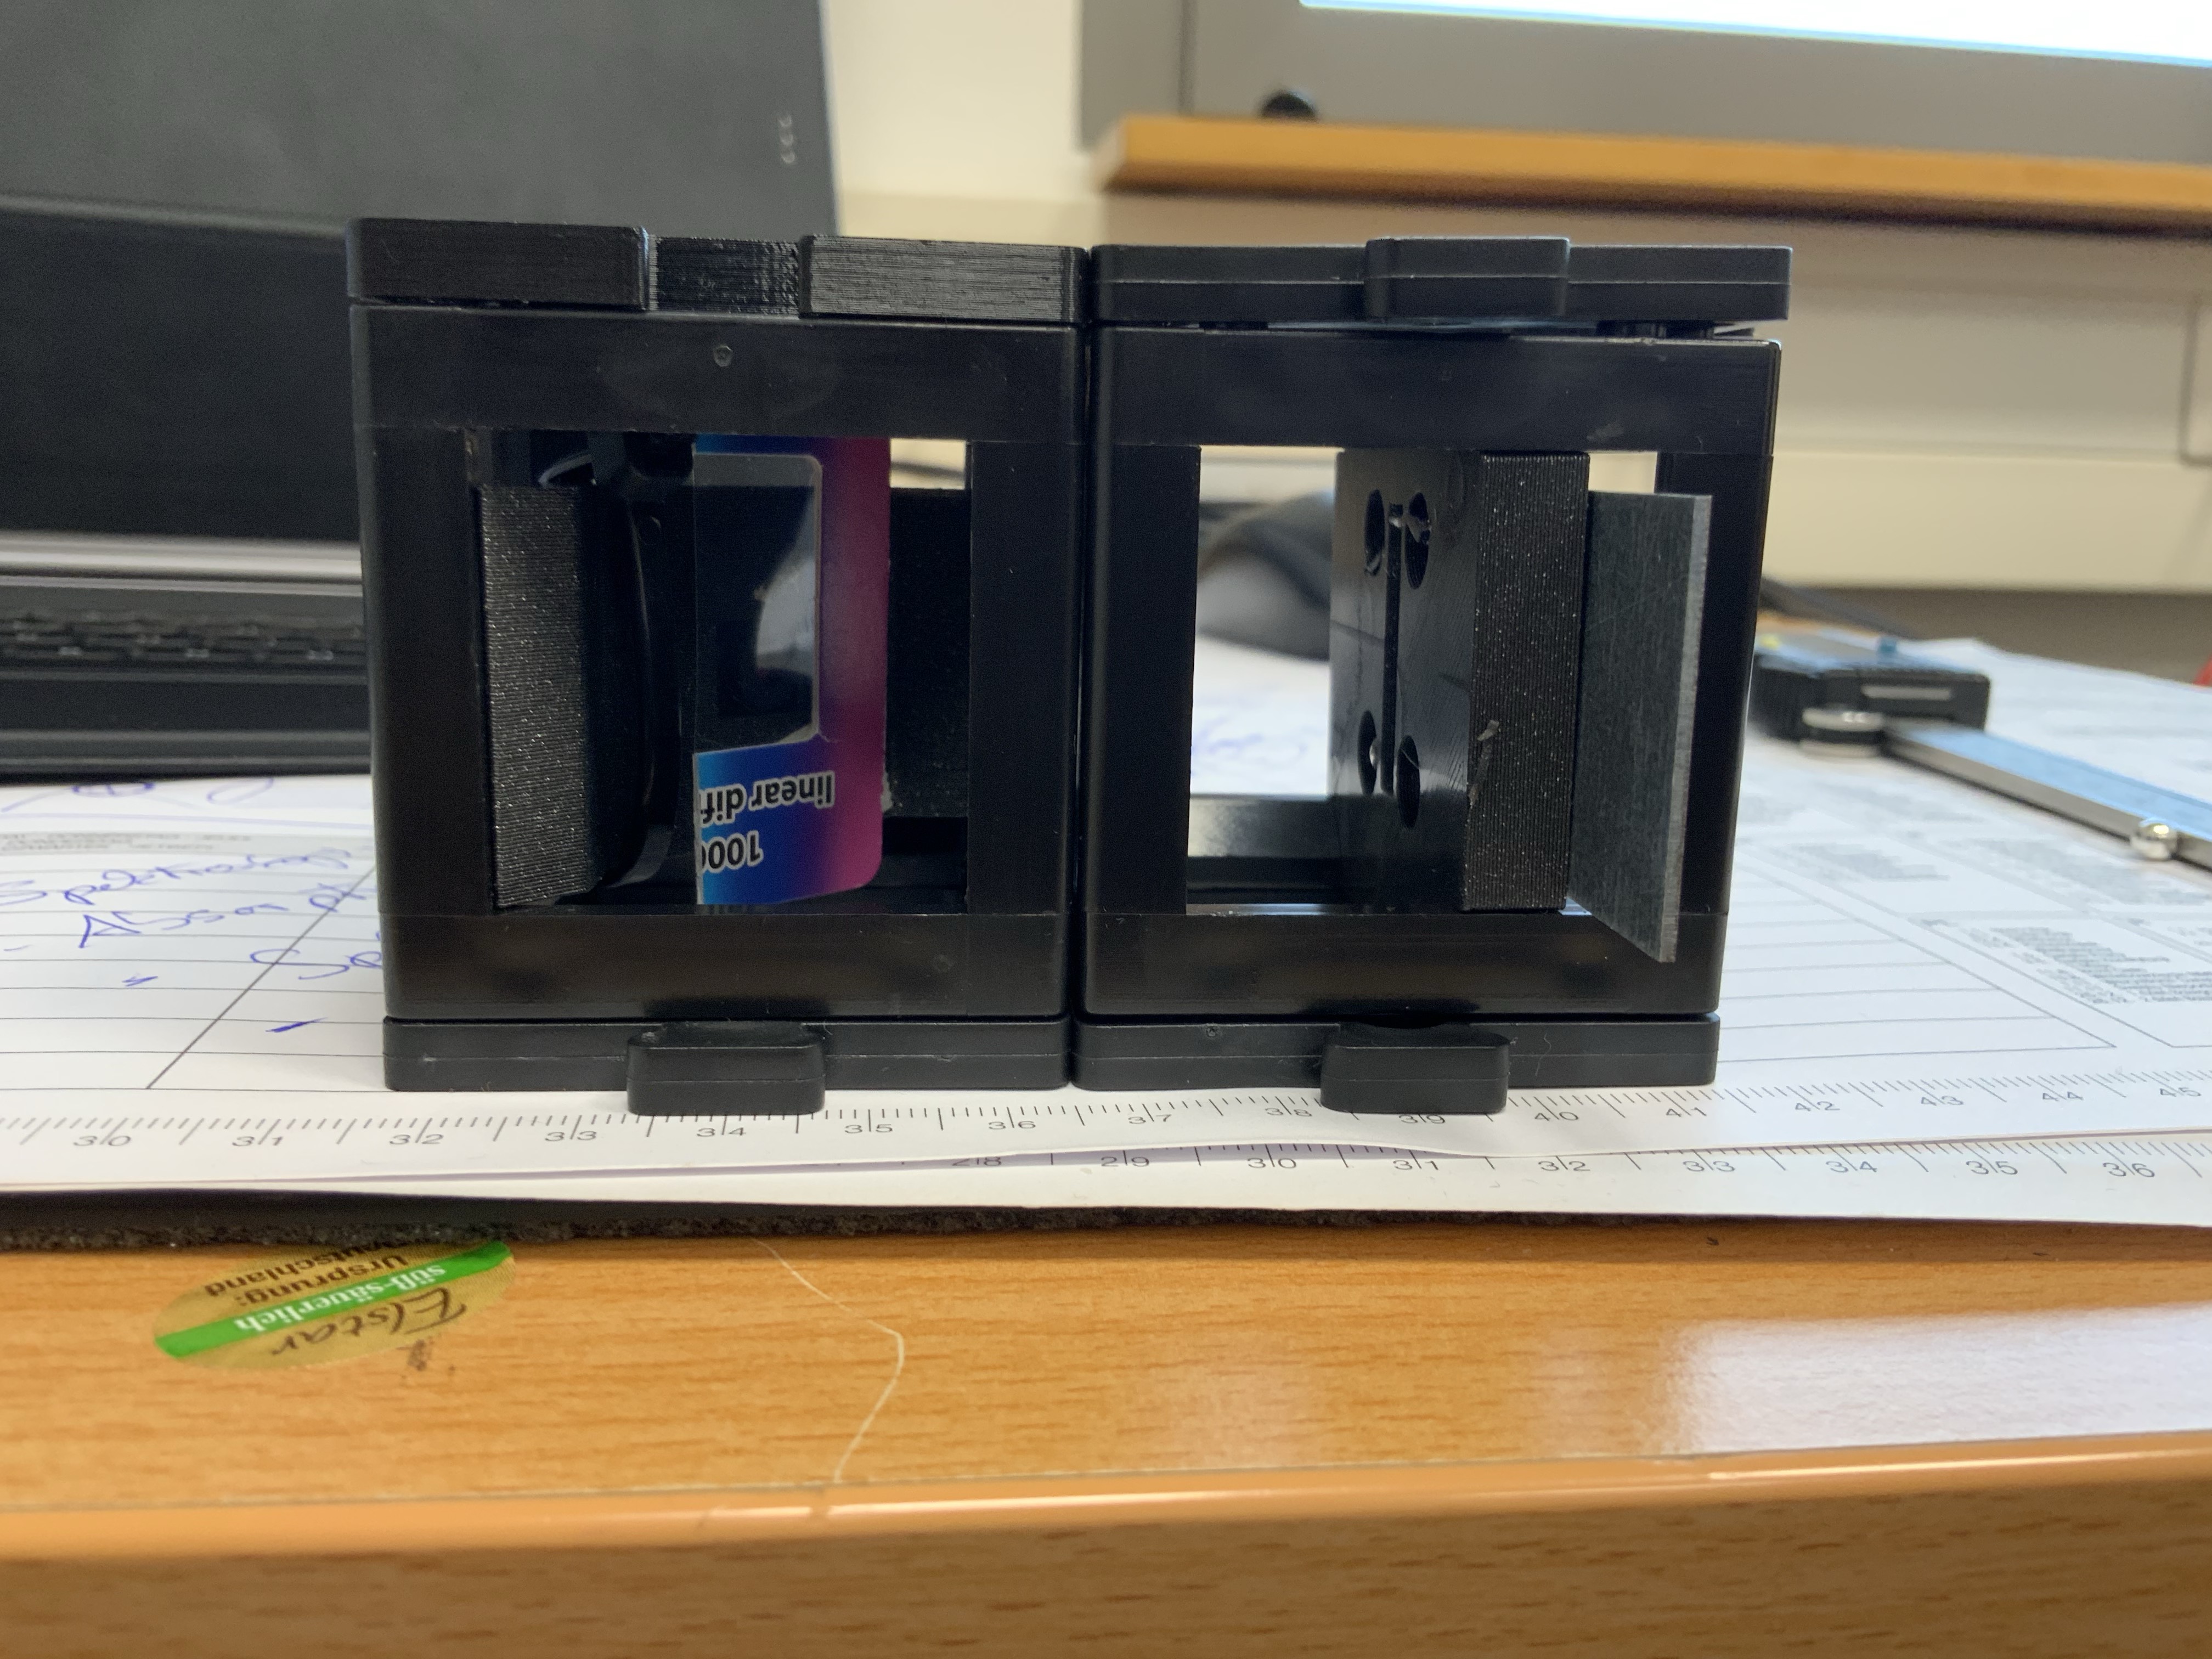 1. Right: Variable Entrance Slit, Left: Diagnoal Camera + Grating
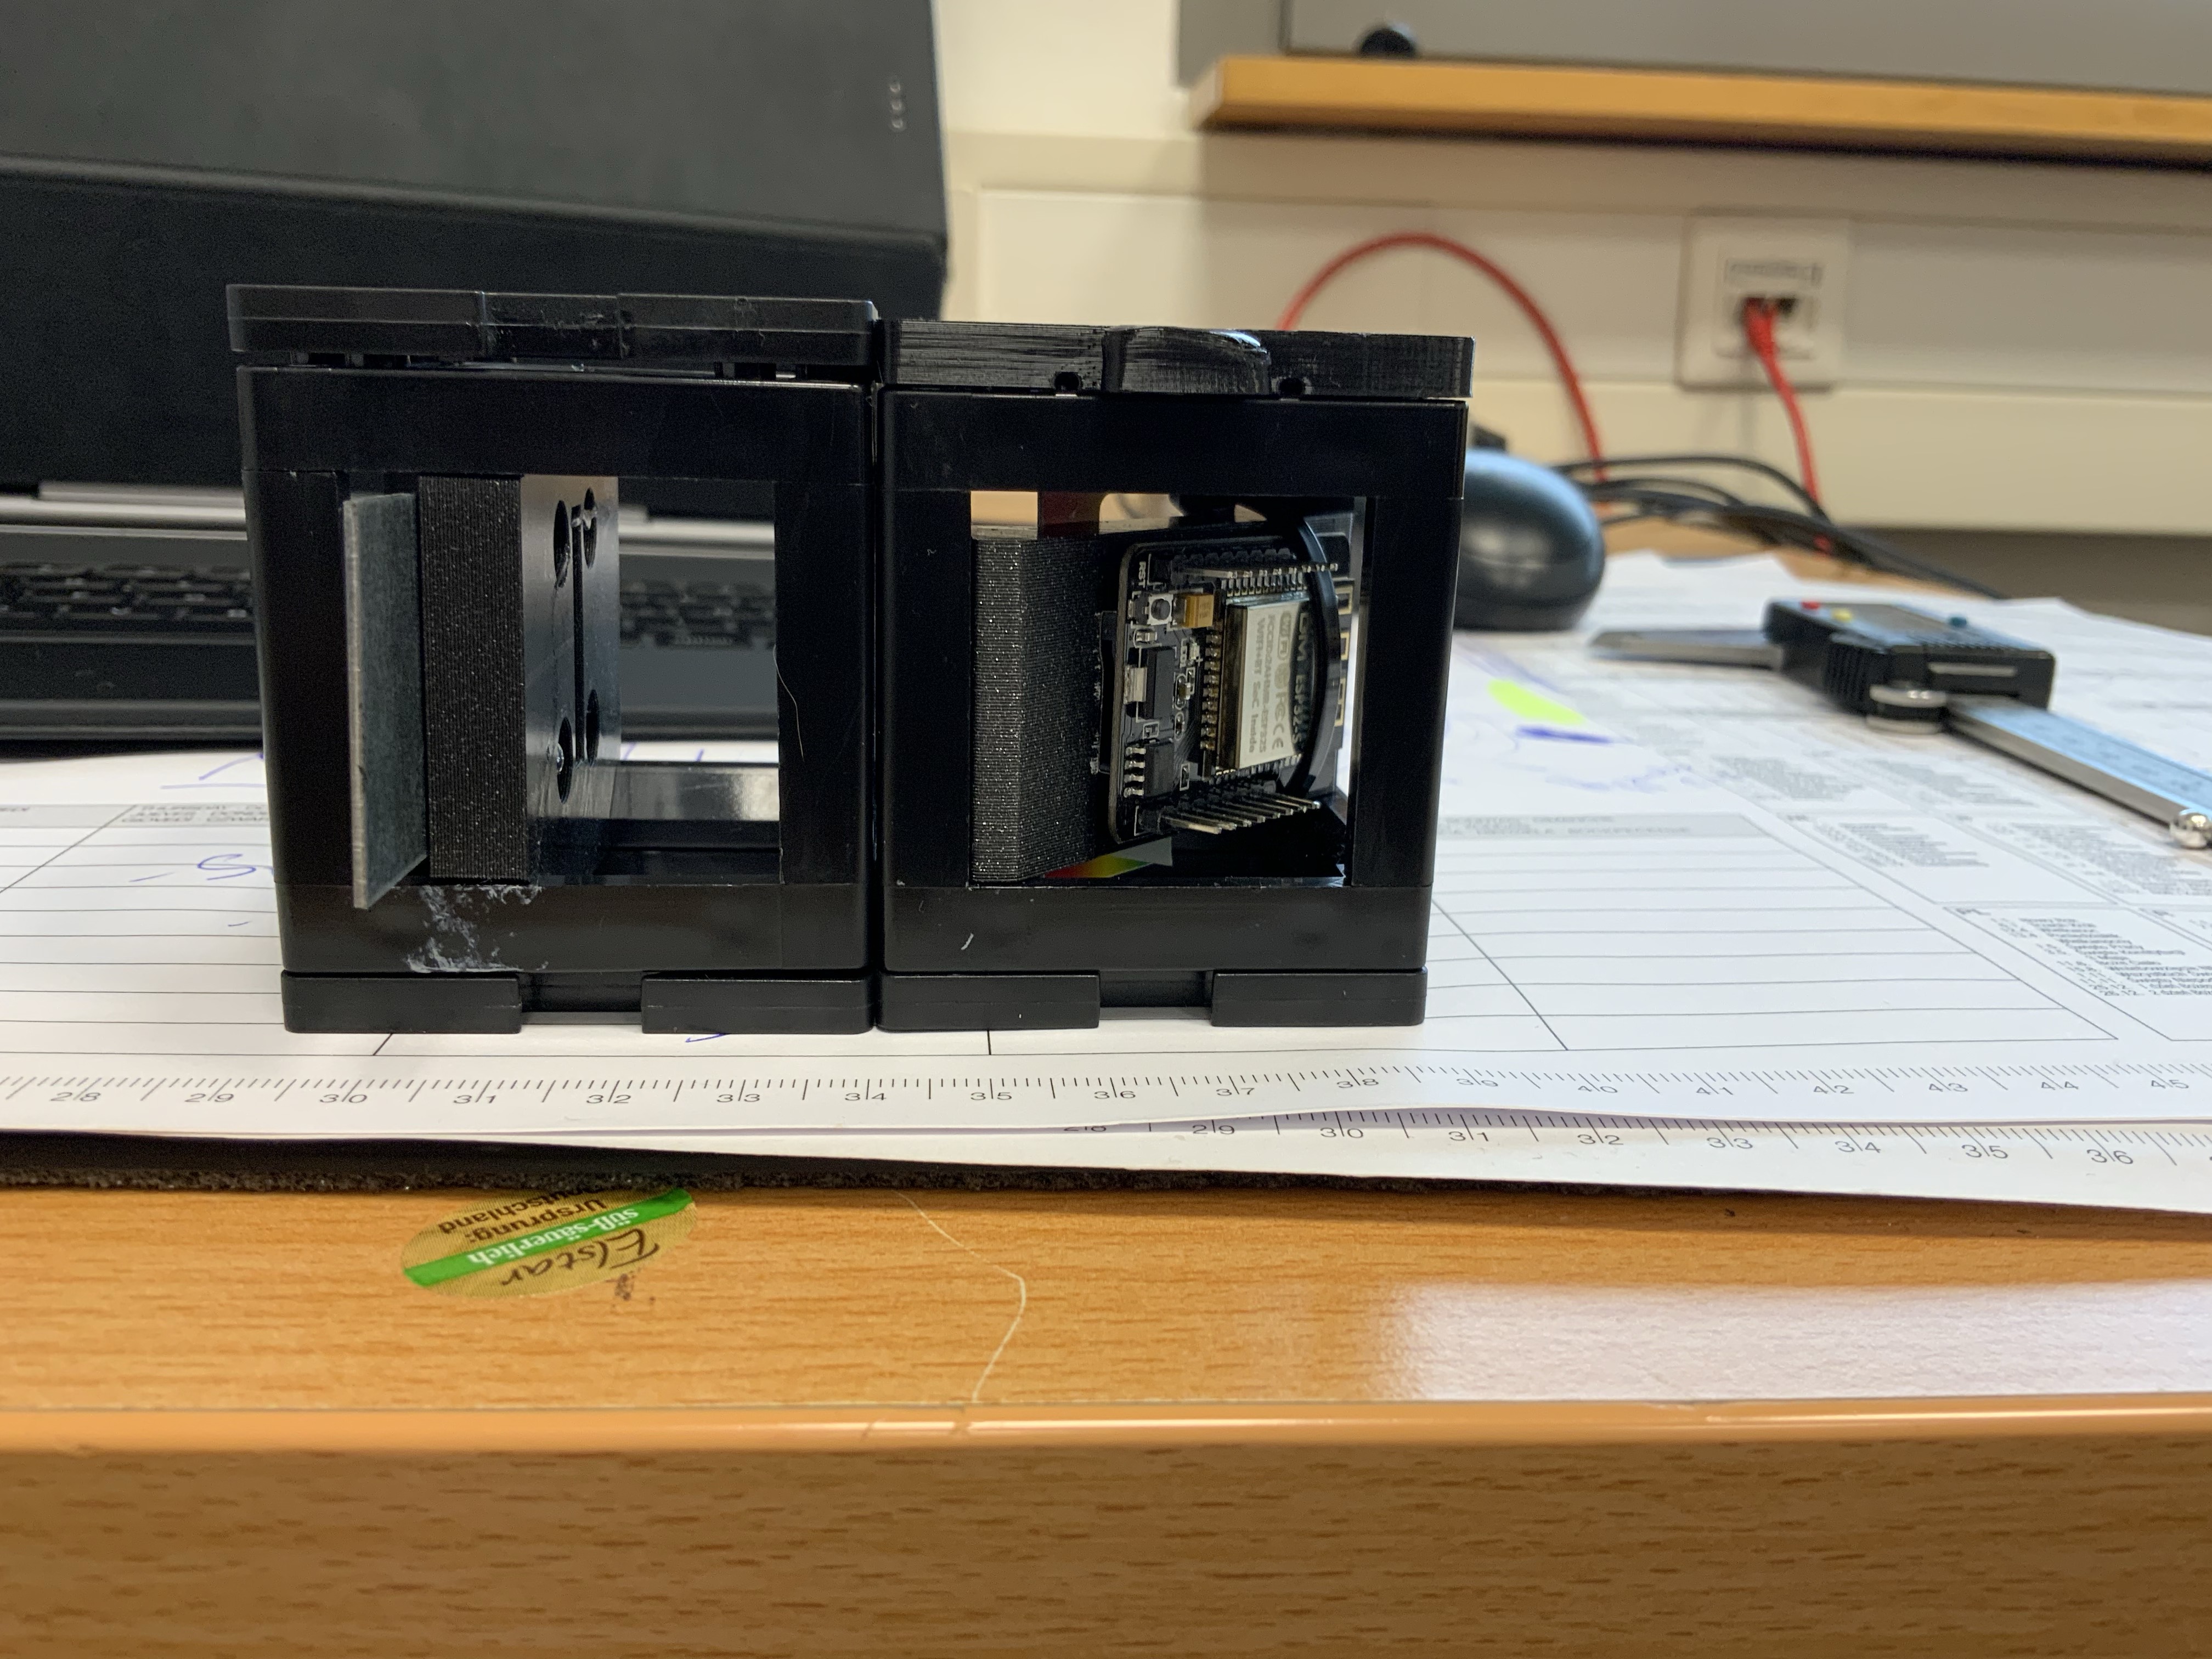 2. Right: ESP32 Camera for the detection of the diffracted light
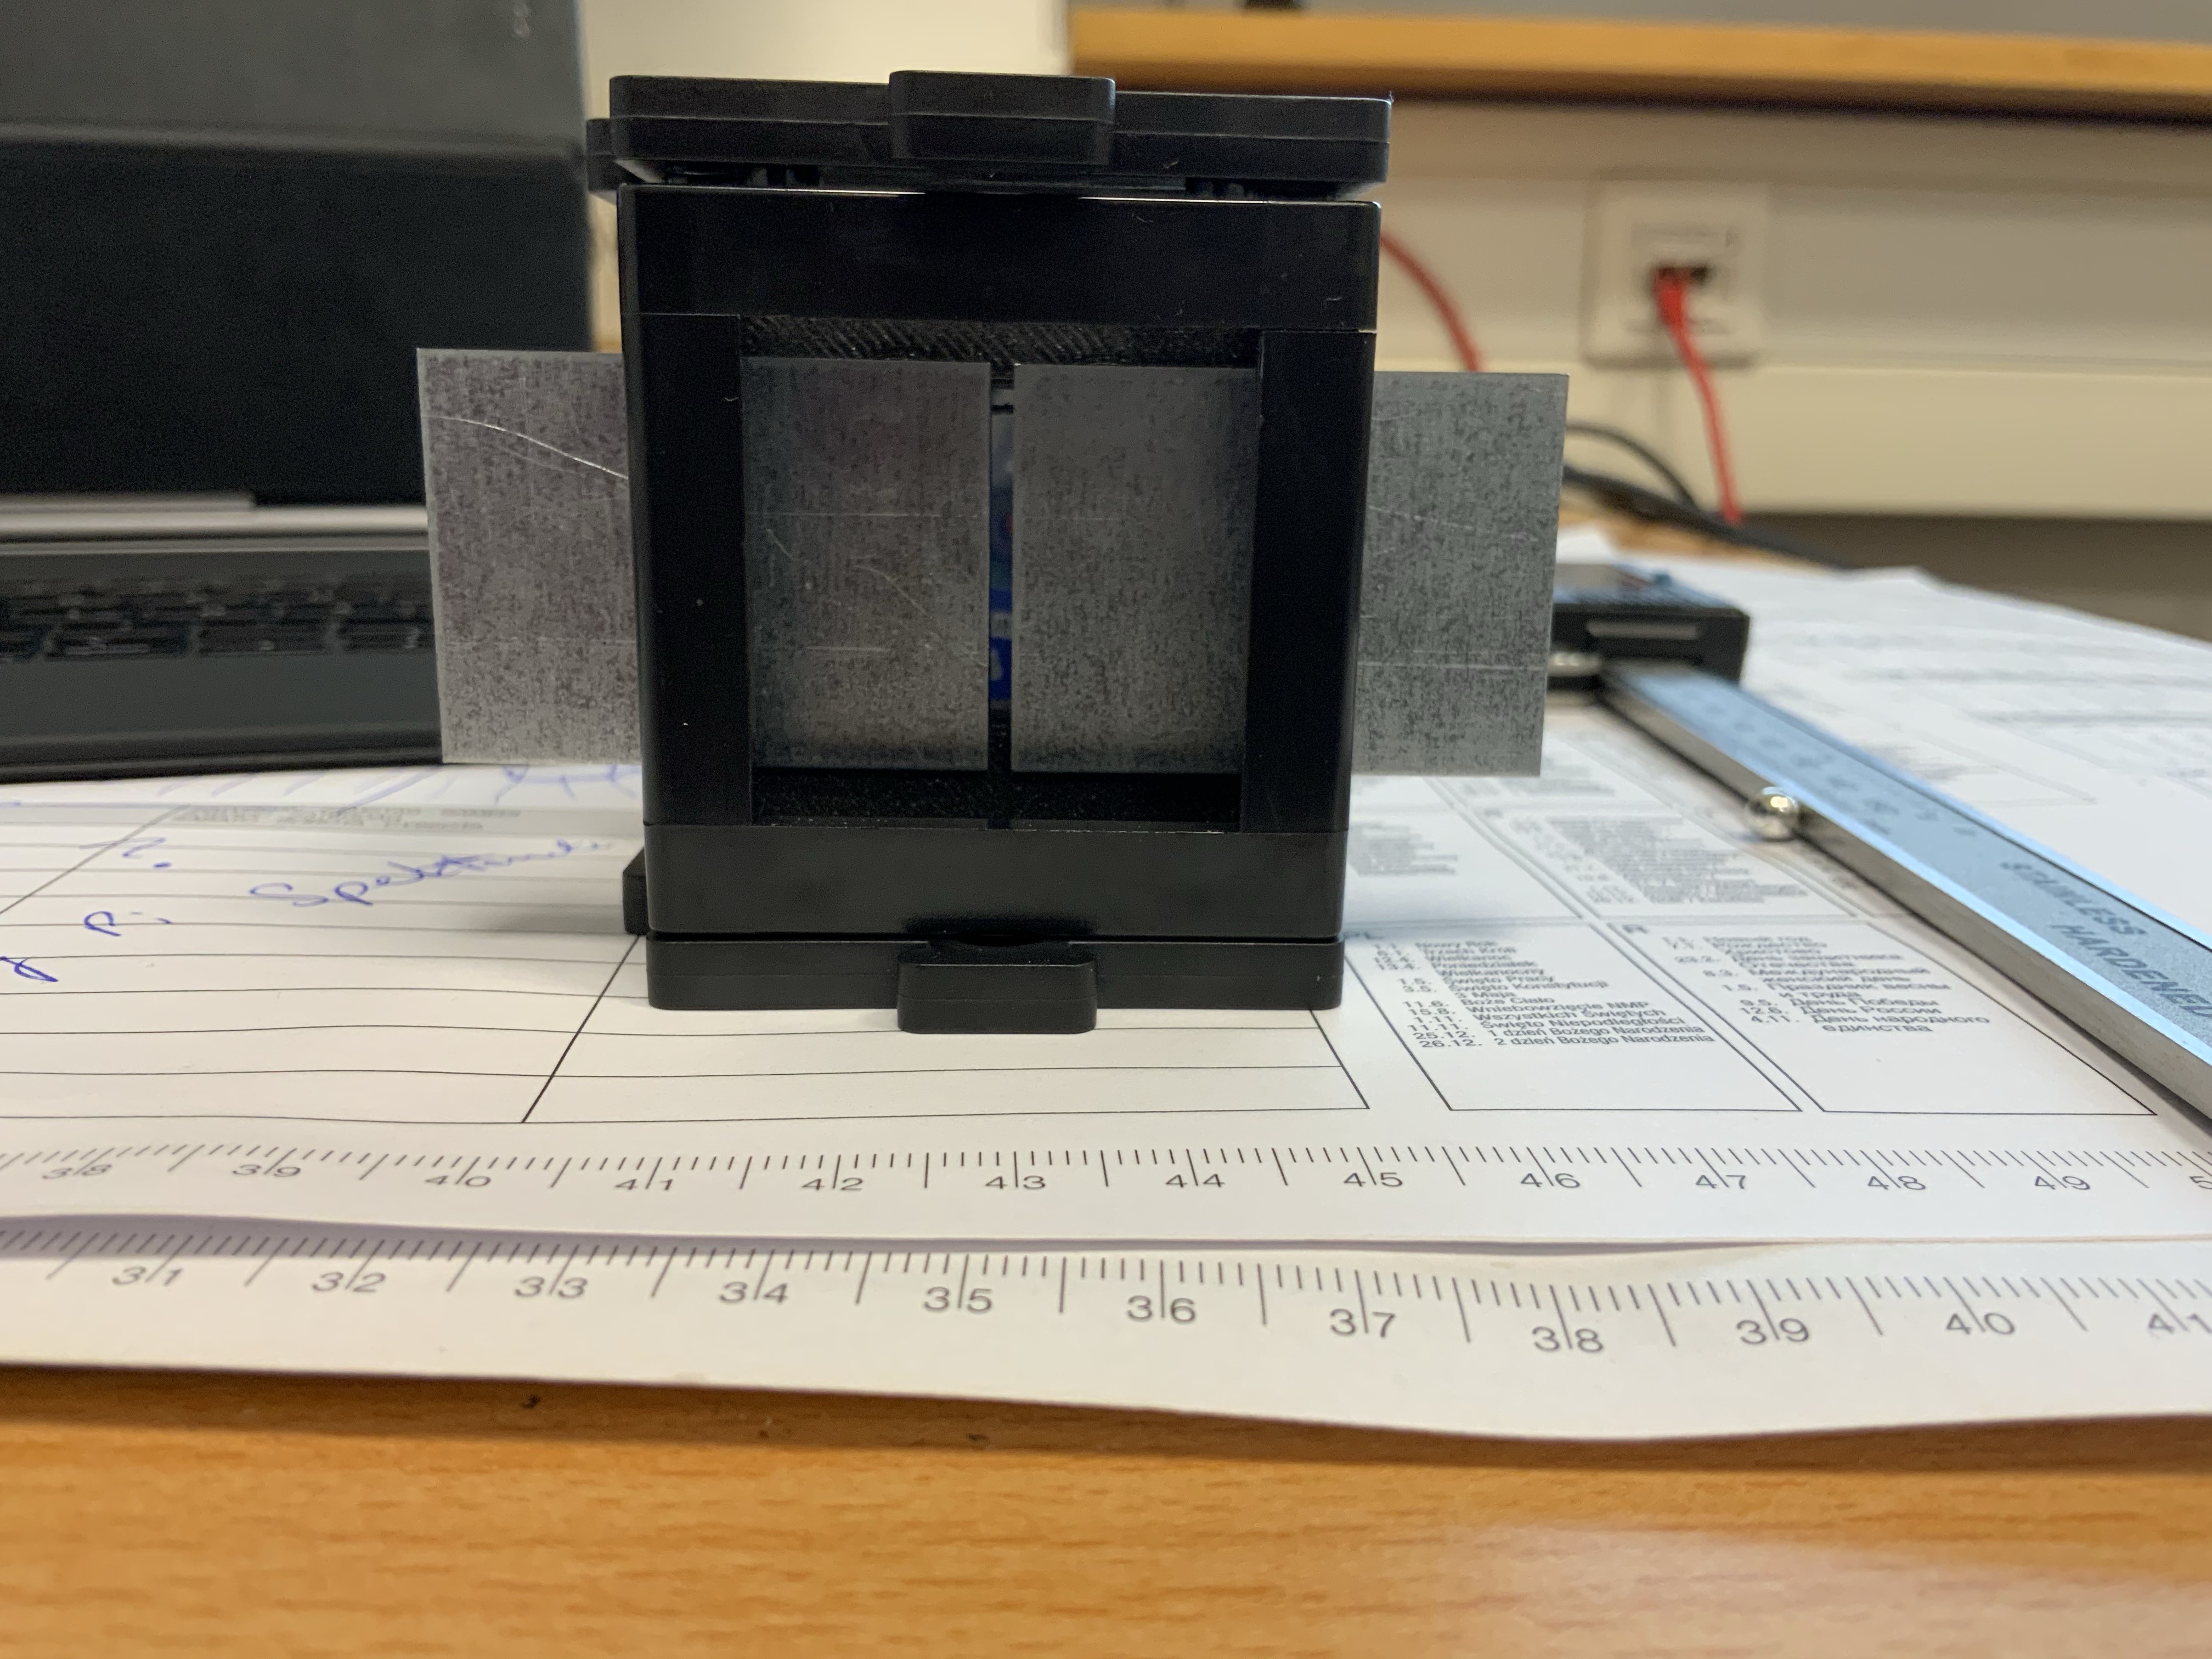 3. Front view of the magnetically mounted entrance slit
 4. Side covers to block straylight
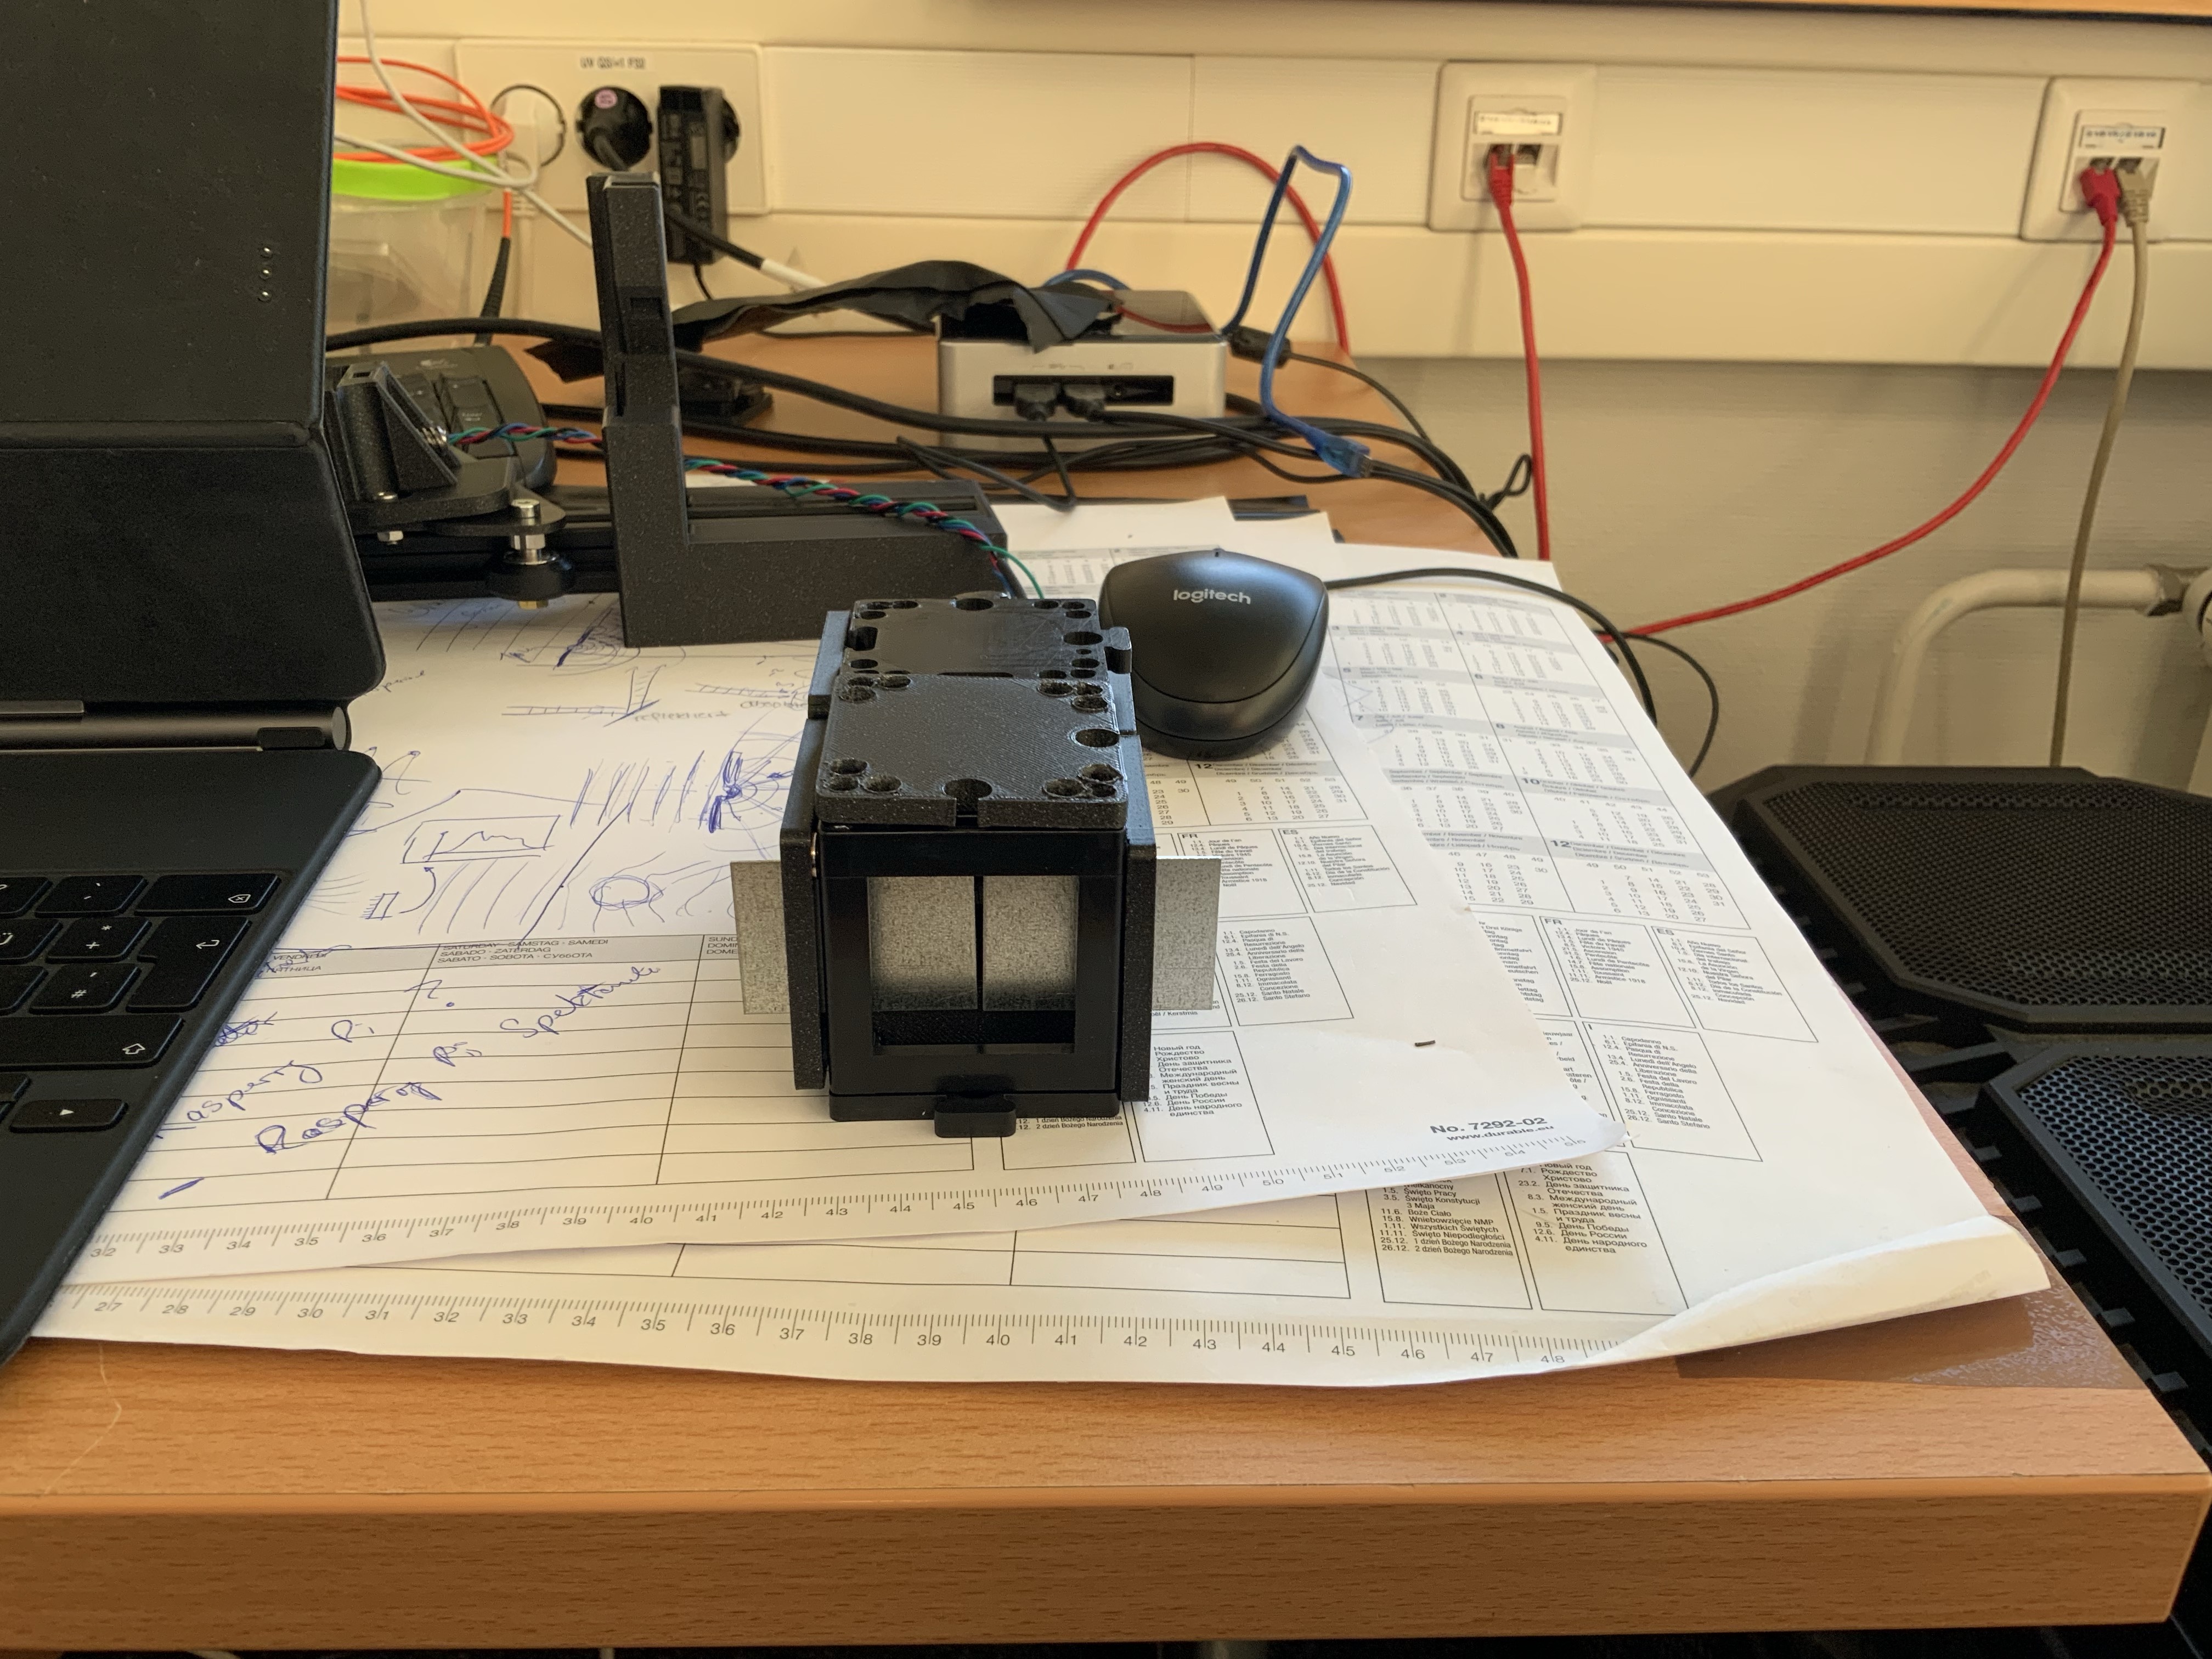 5. Fully assembled Spectrometer
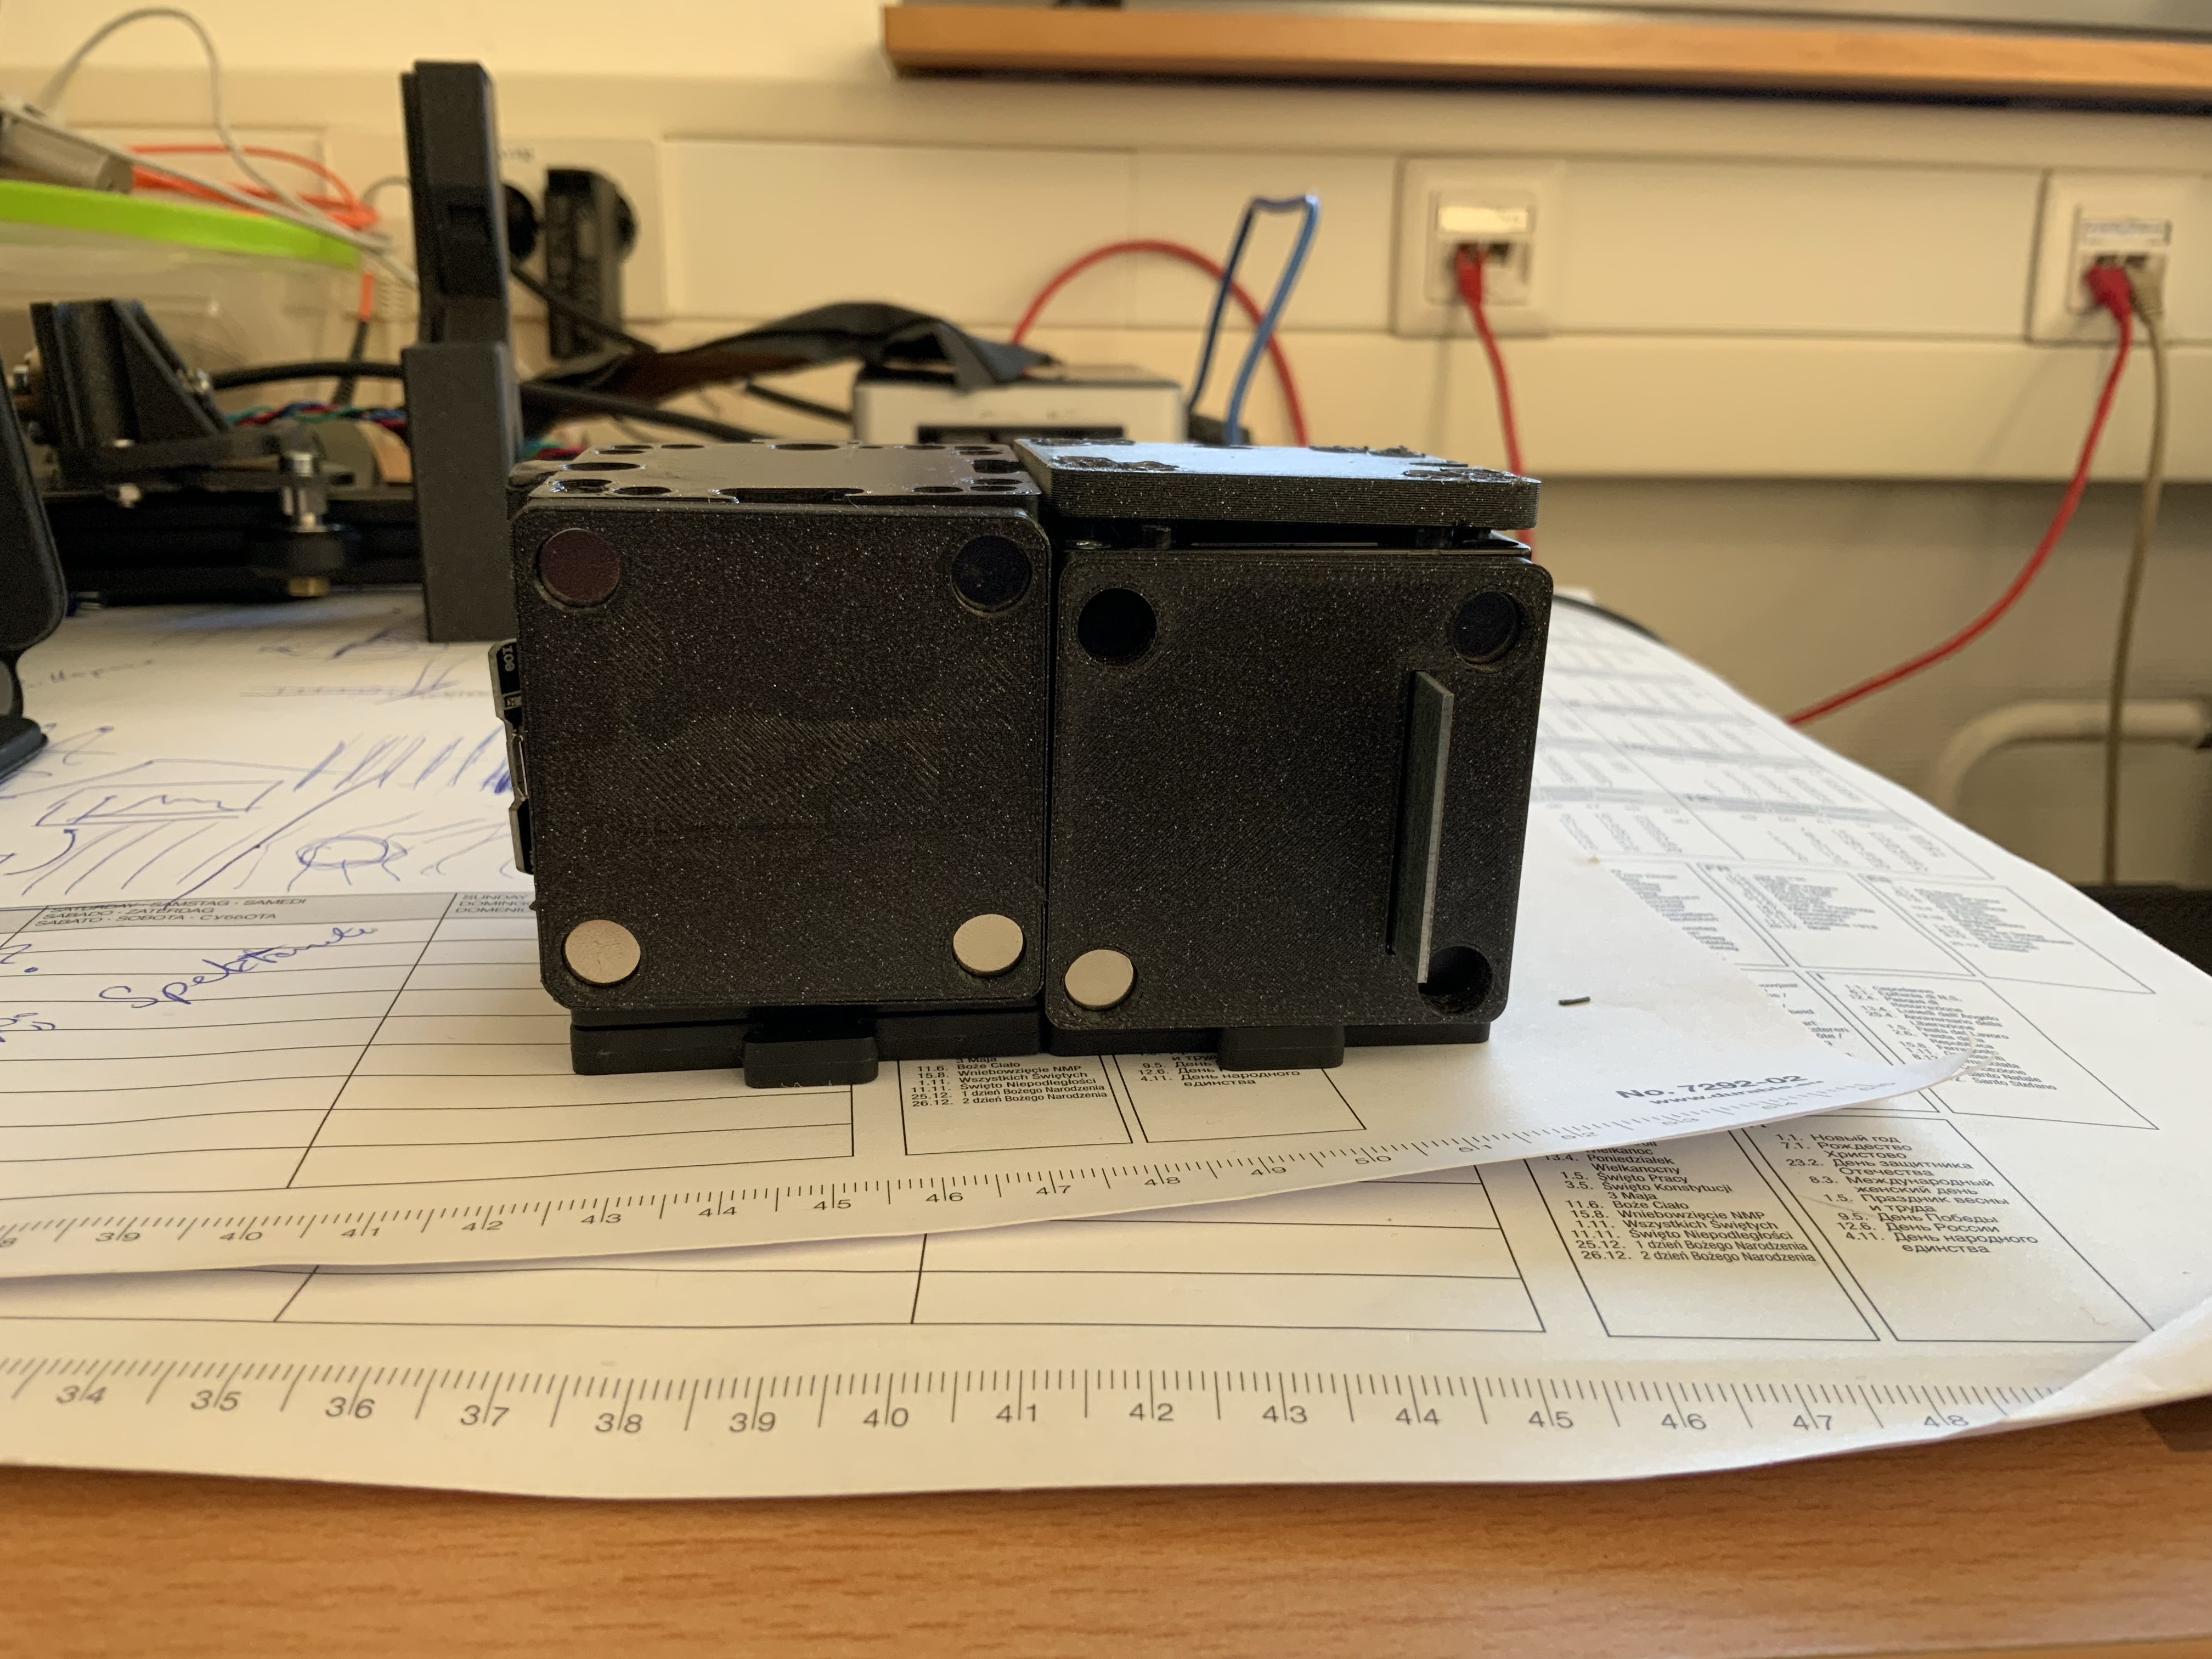 6. Fully covered Spectrometer
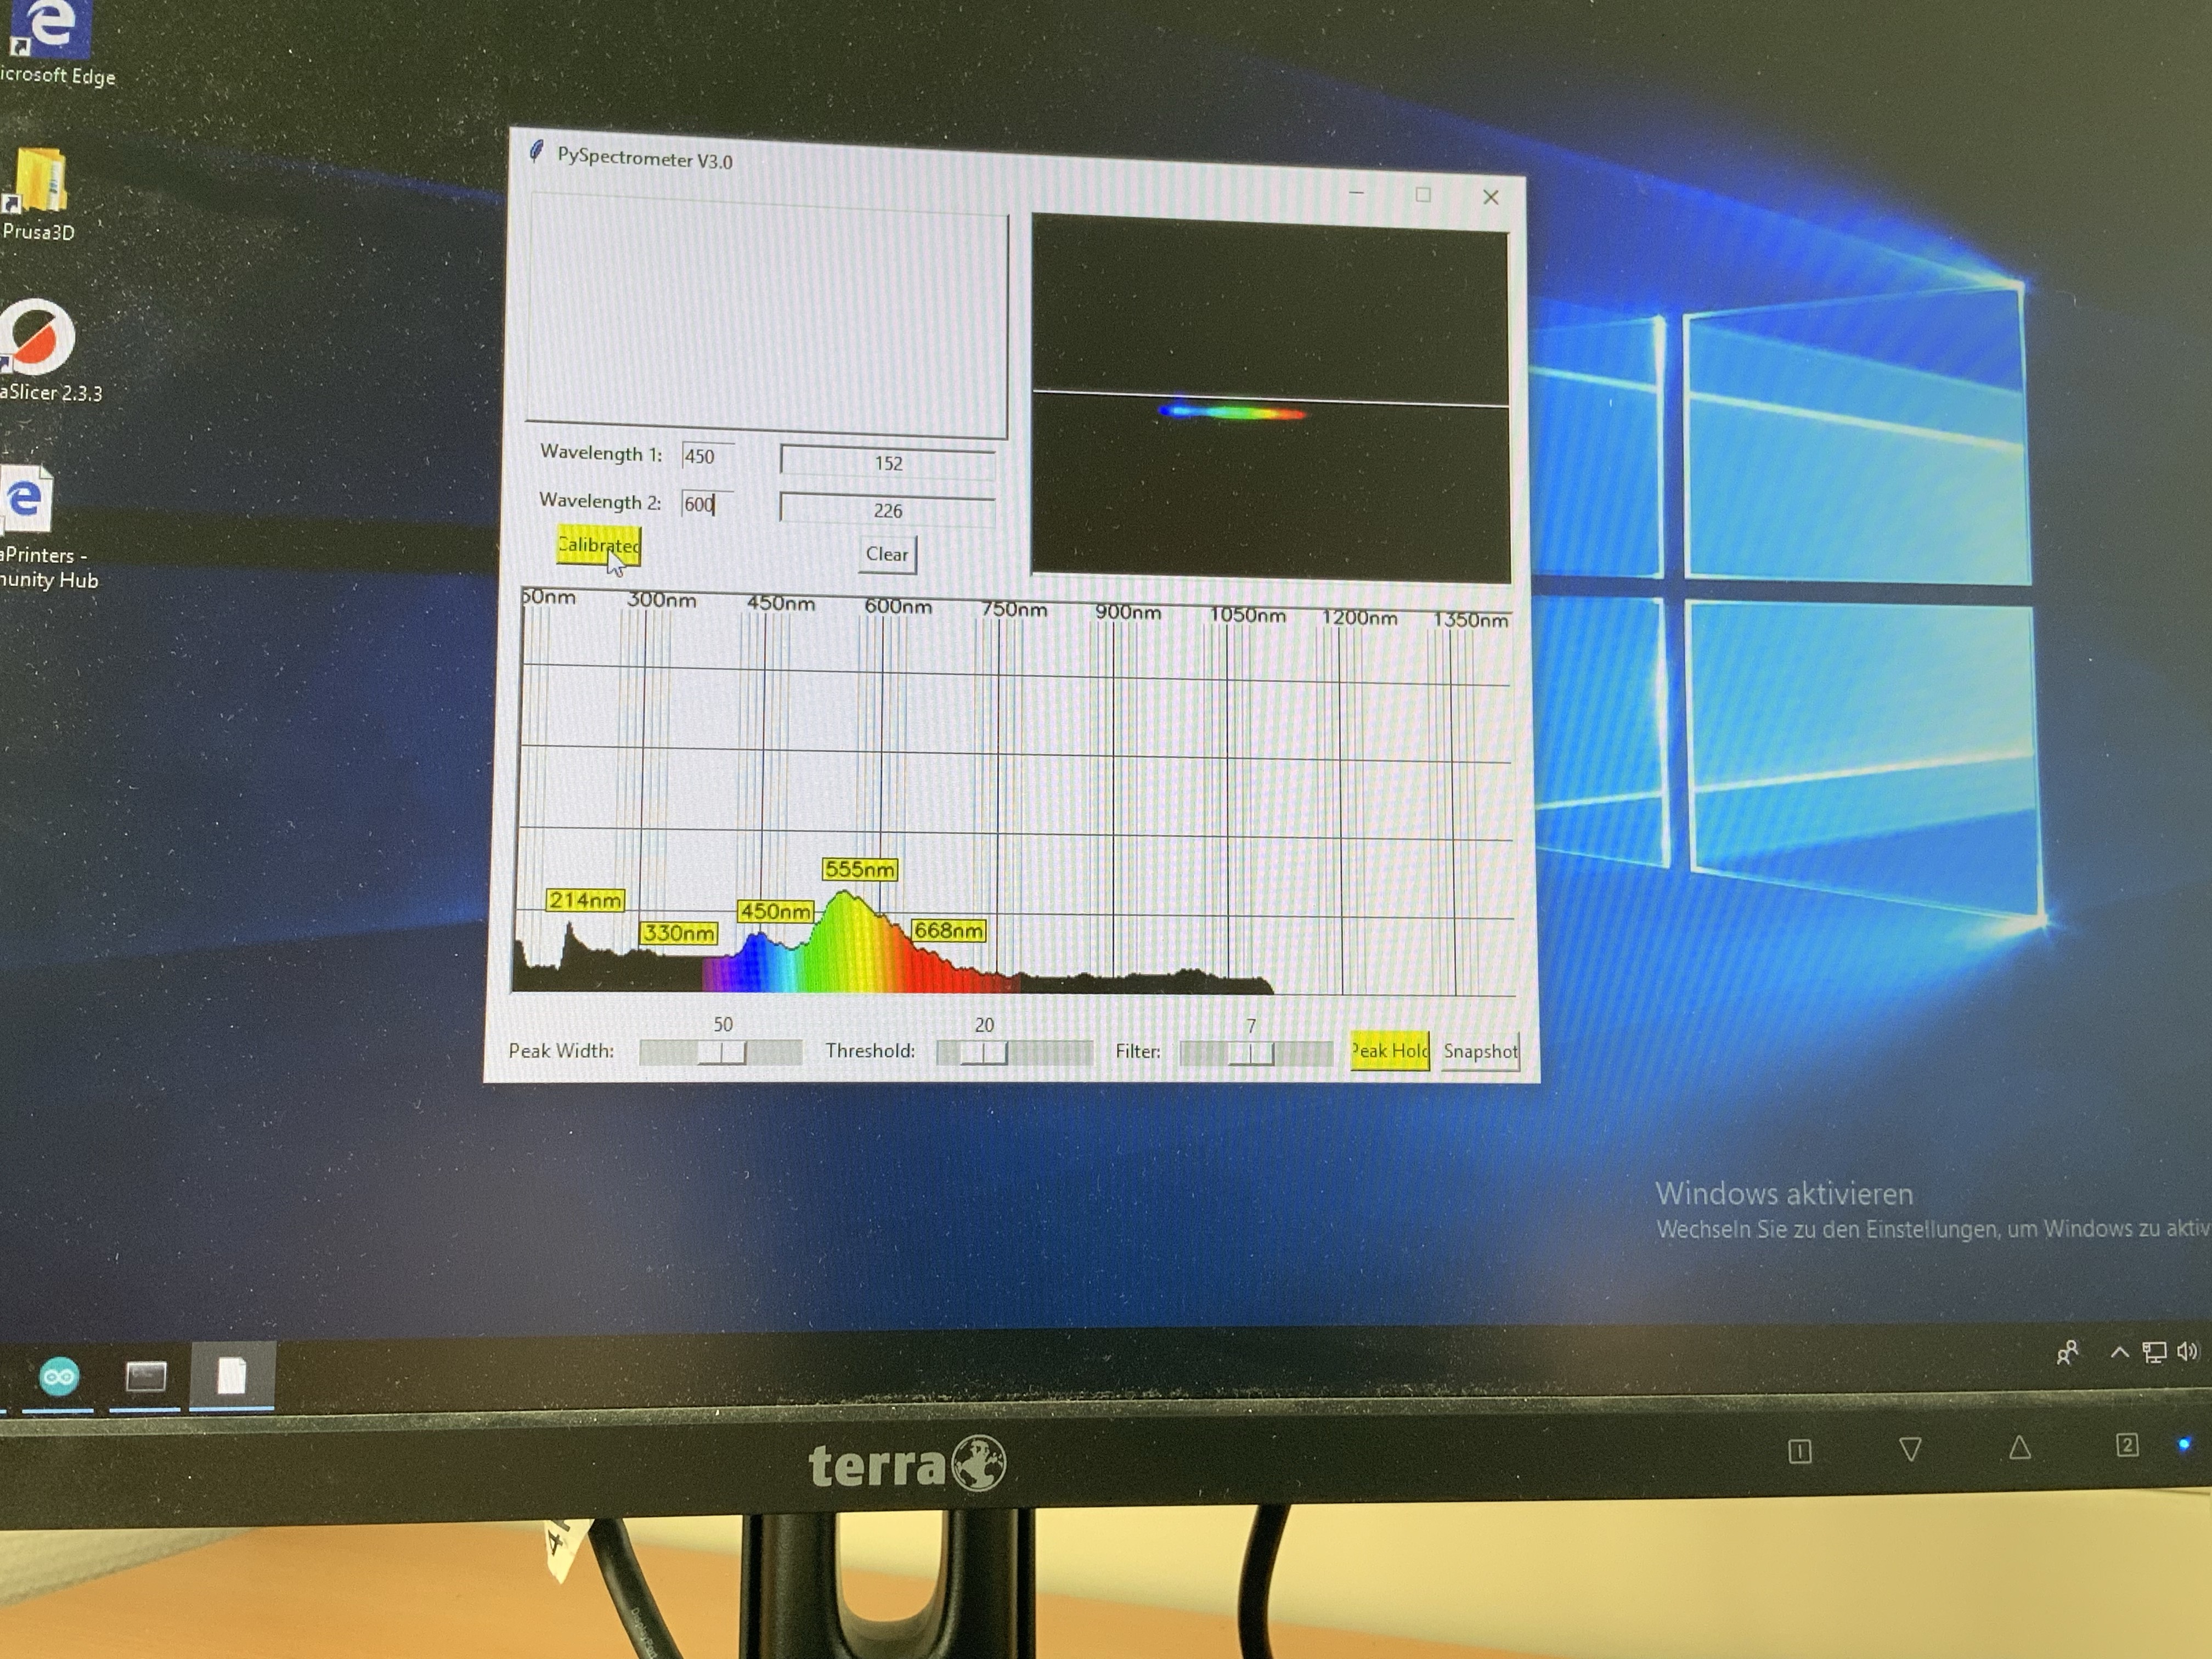
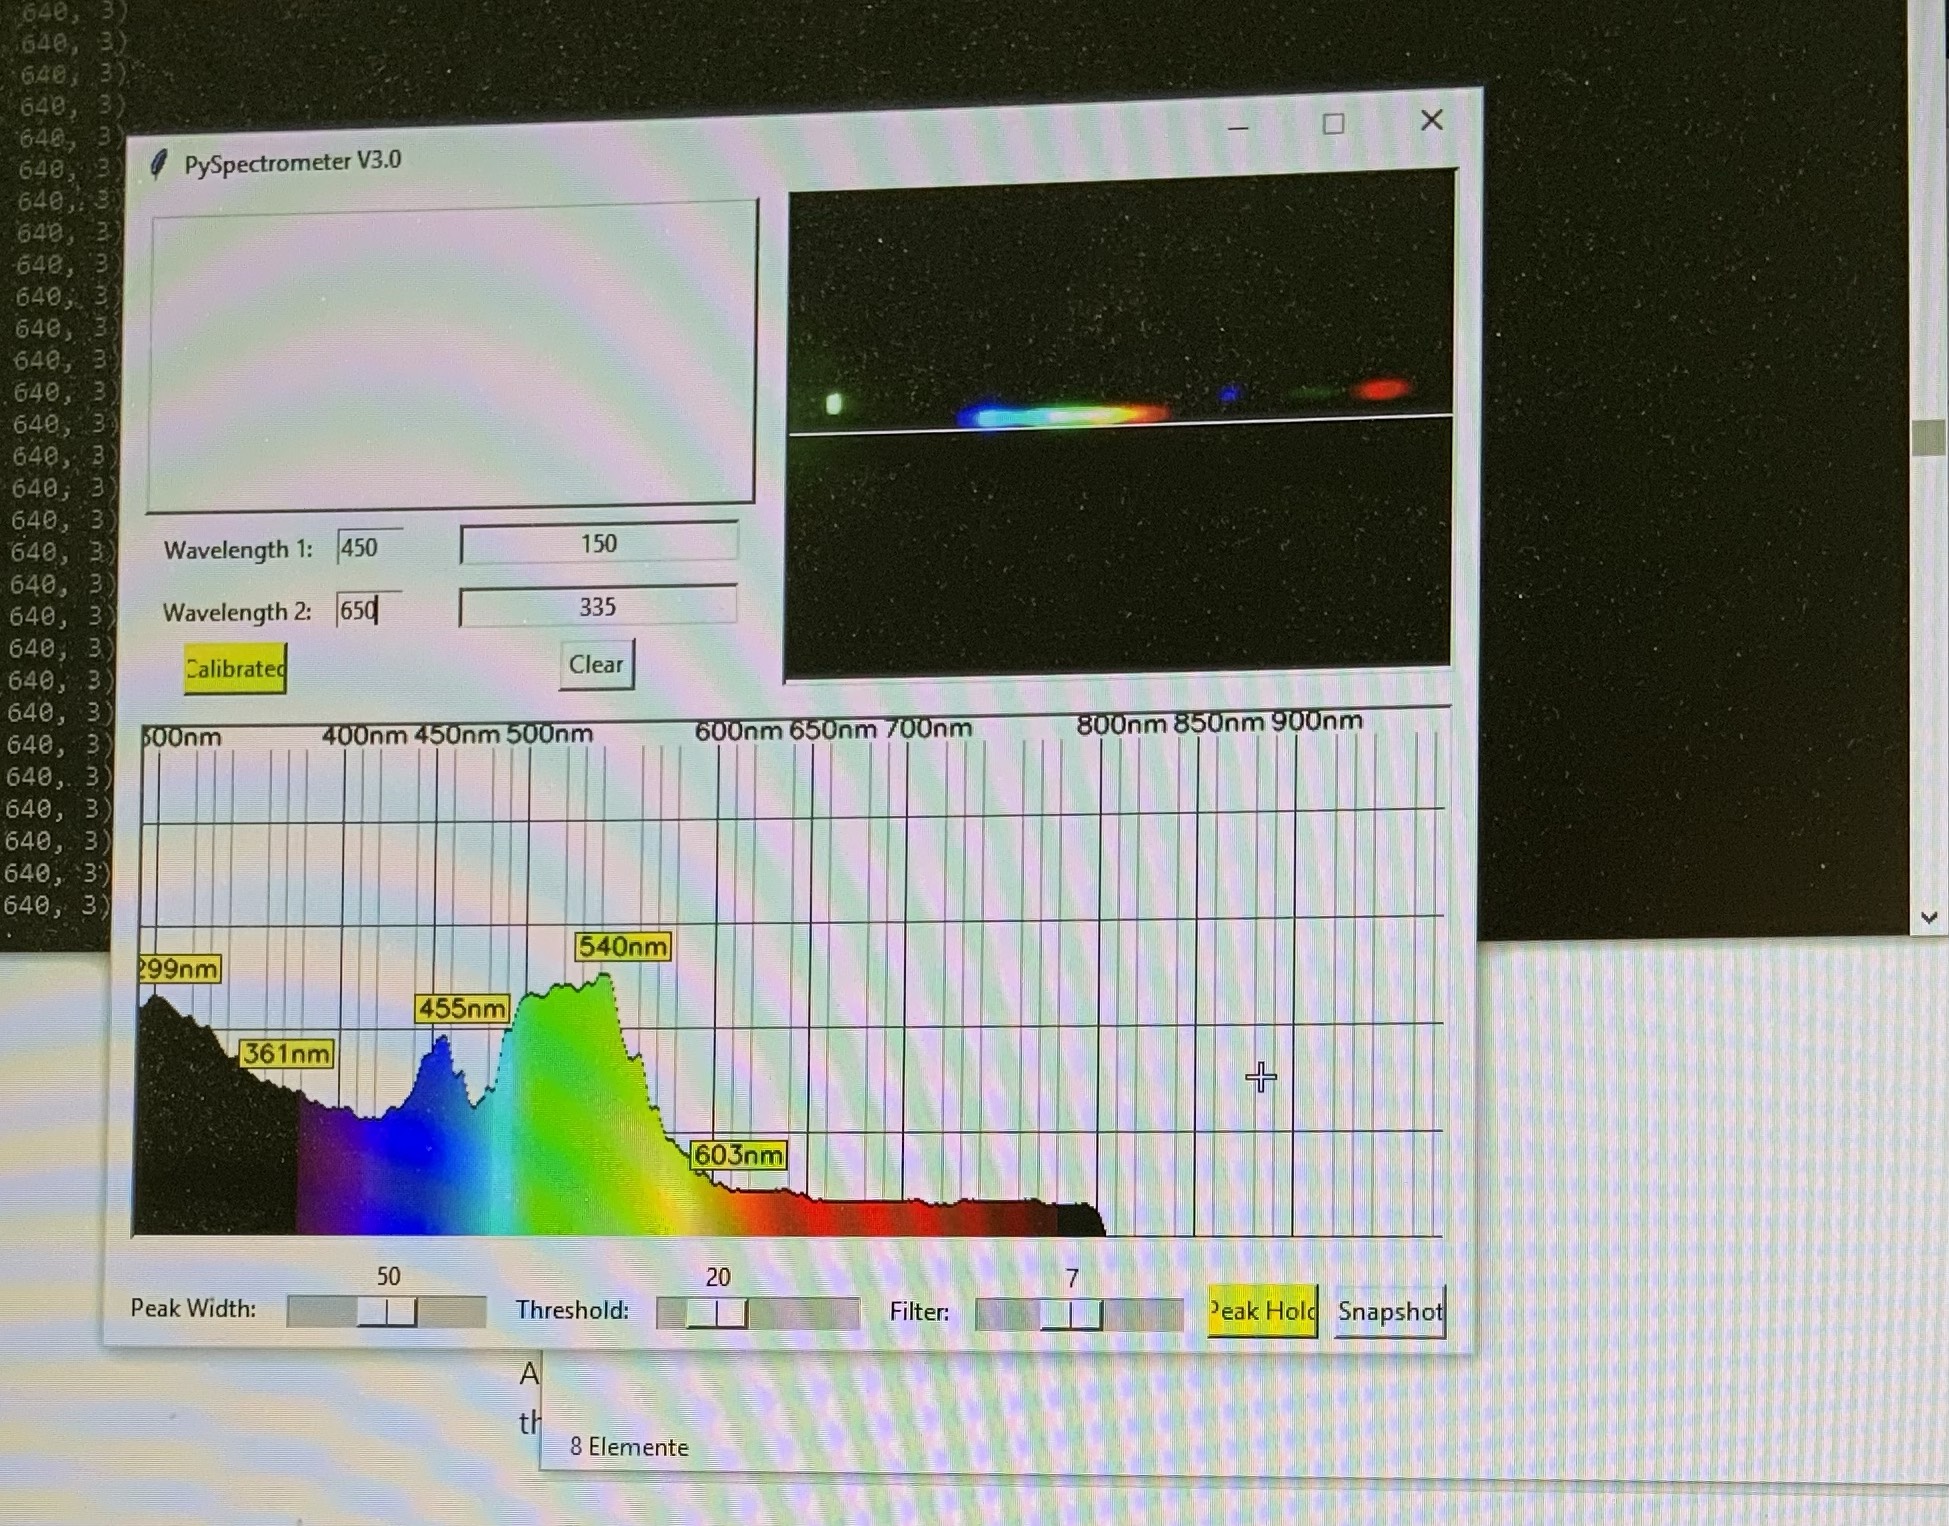 7. Python Programm to convert the lineplot into a spectrum - See folder PYTHON
 8. Example Plot of a spectrum (white light)
Operating the Spectrometer
- Calibration: Essential for accurate measurements.
- Usage: Can be used to analyze spectra from various light sources.
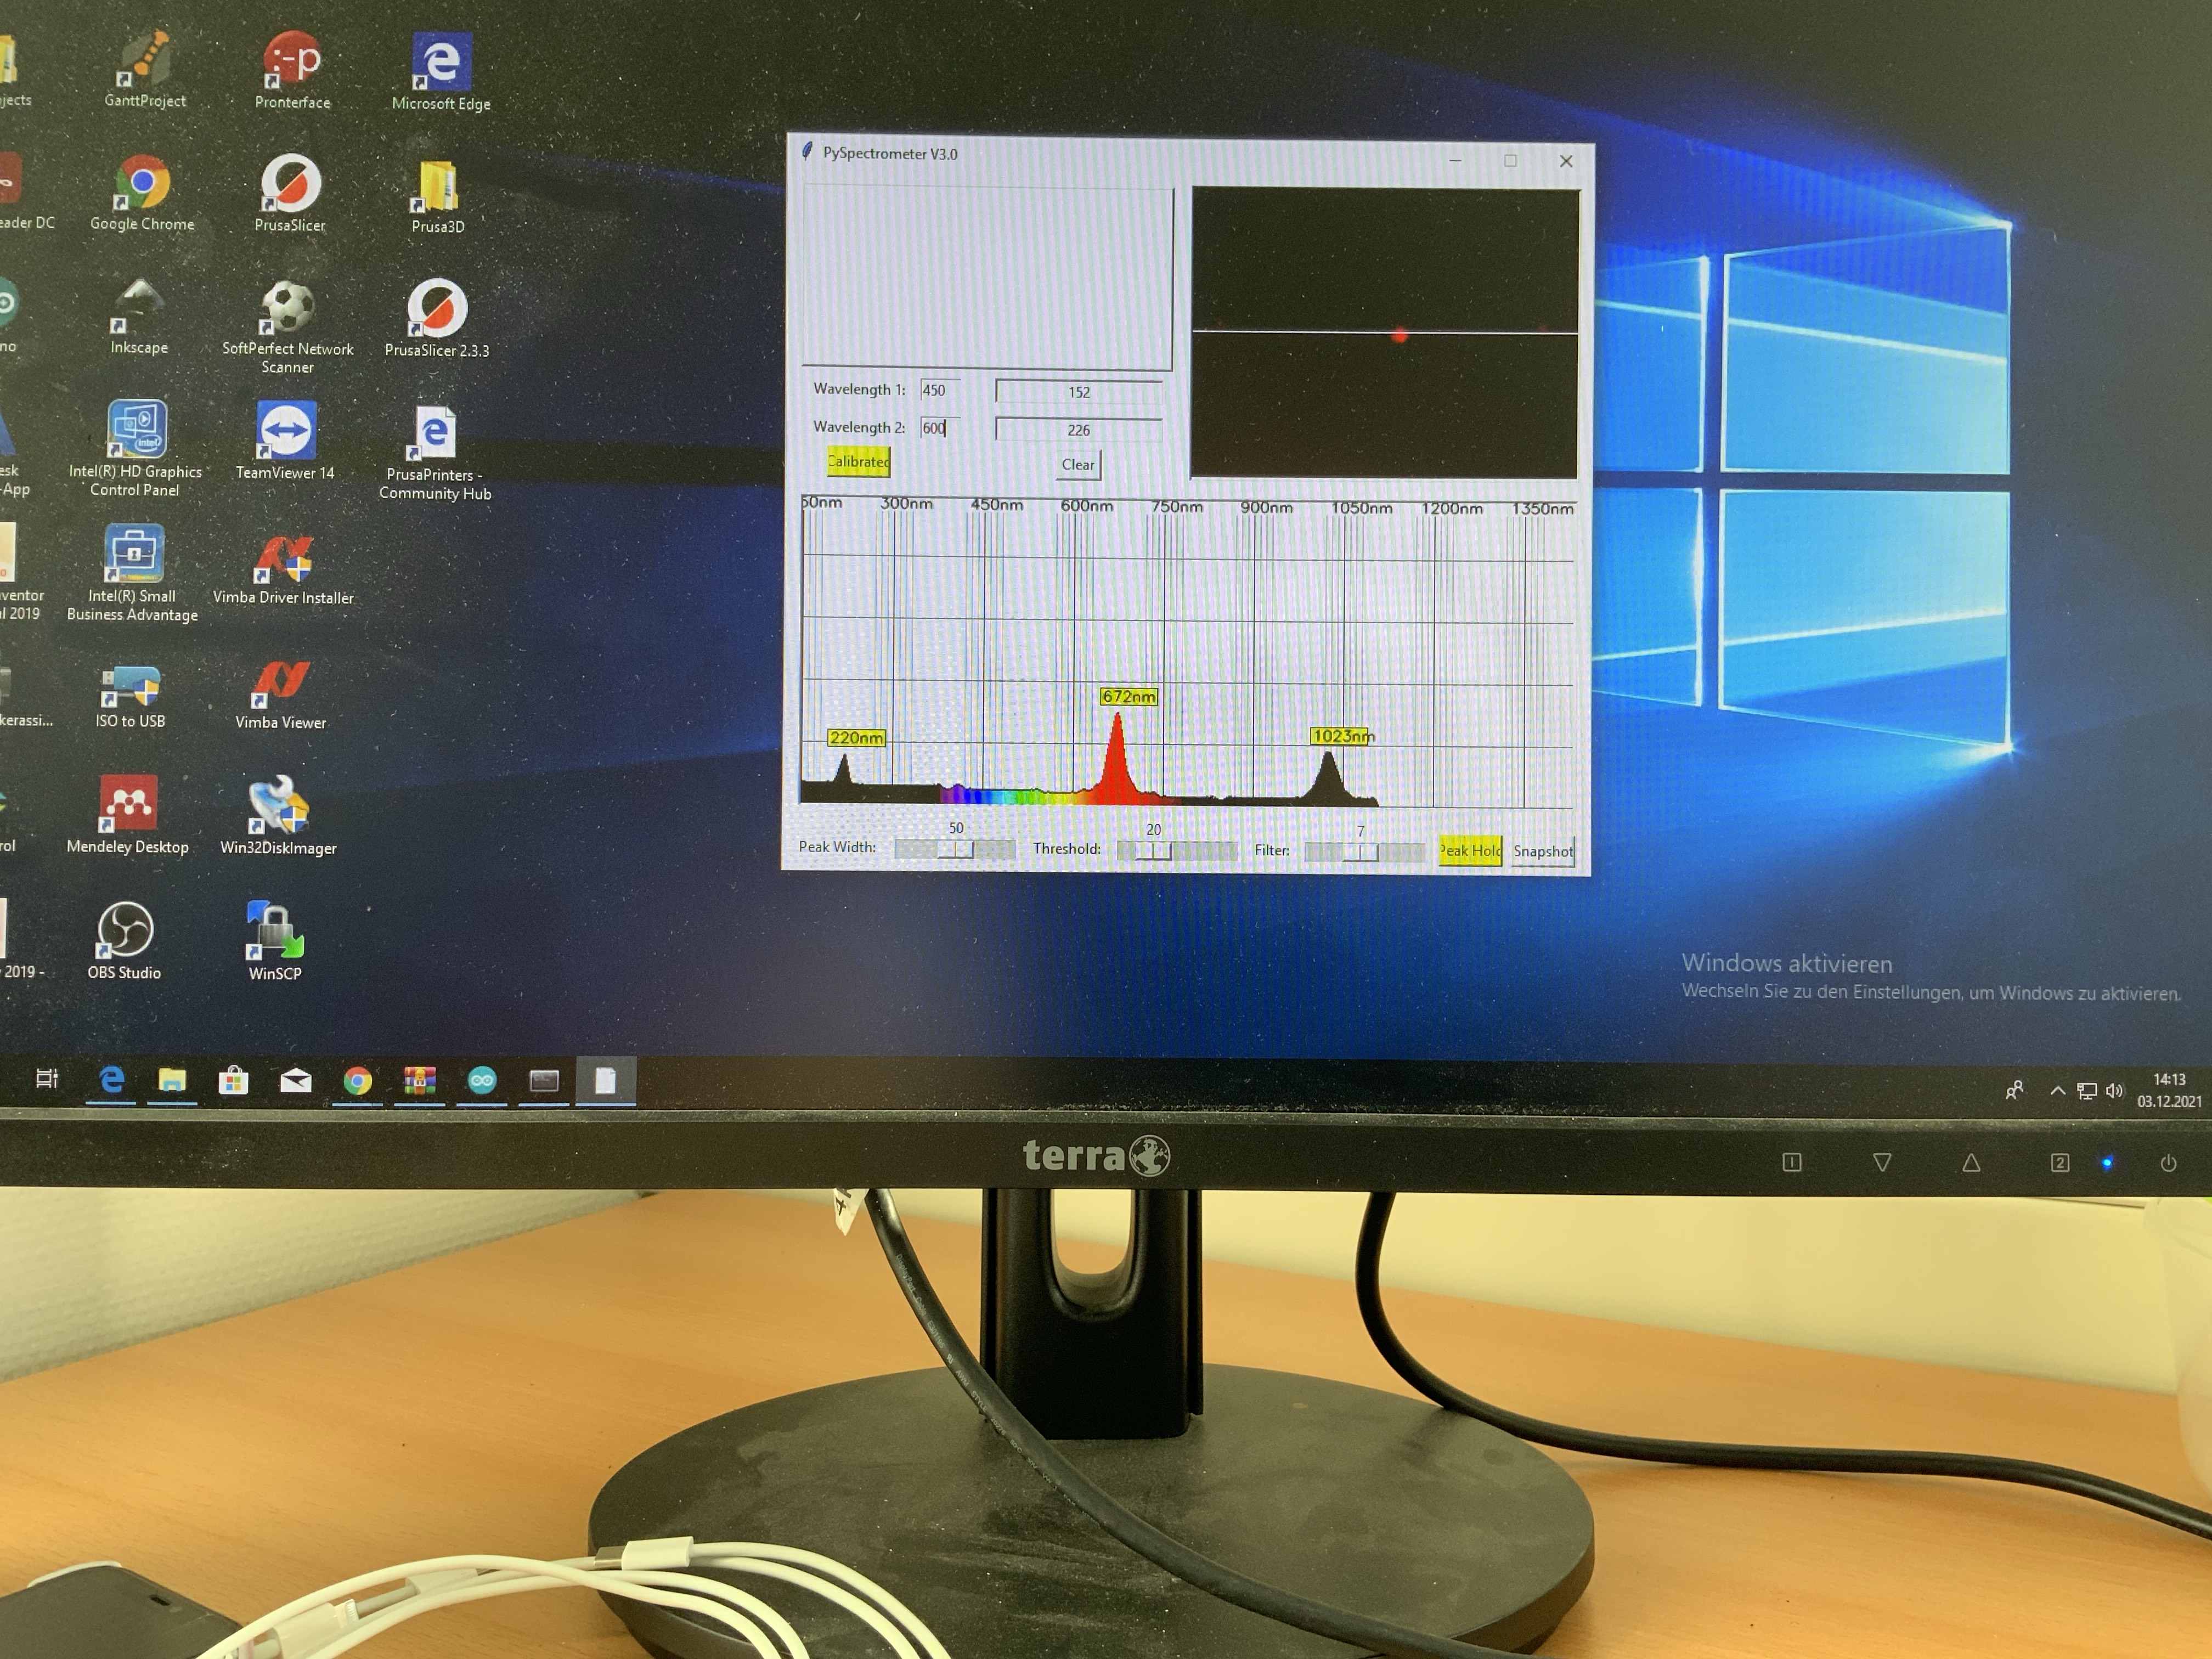 10. Example Plot of a spectrum (red LED)
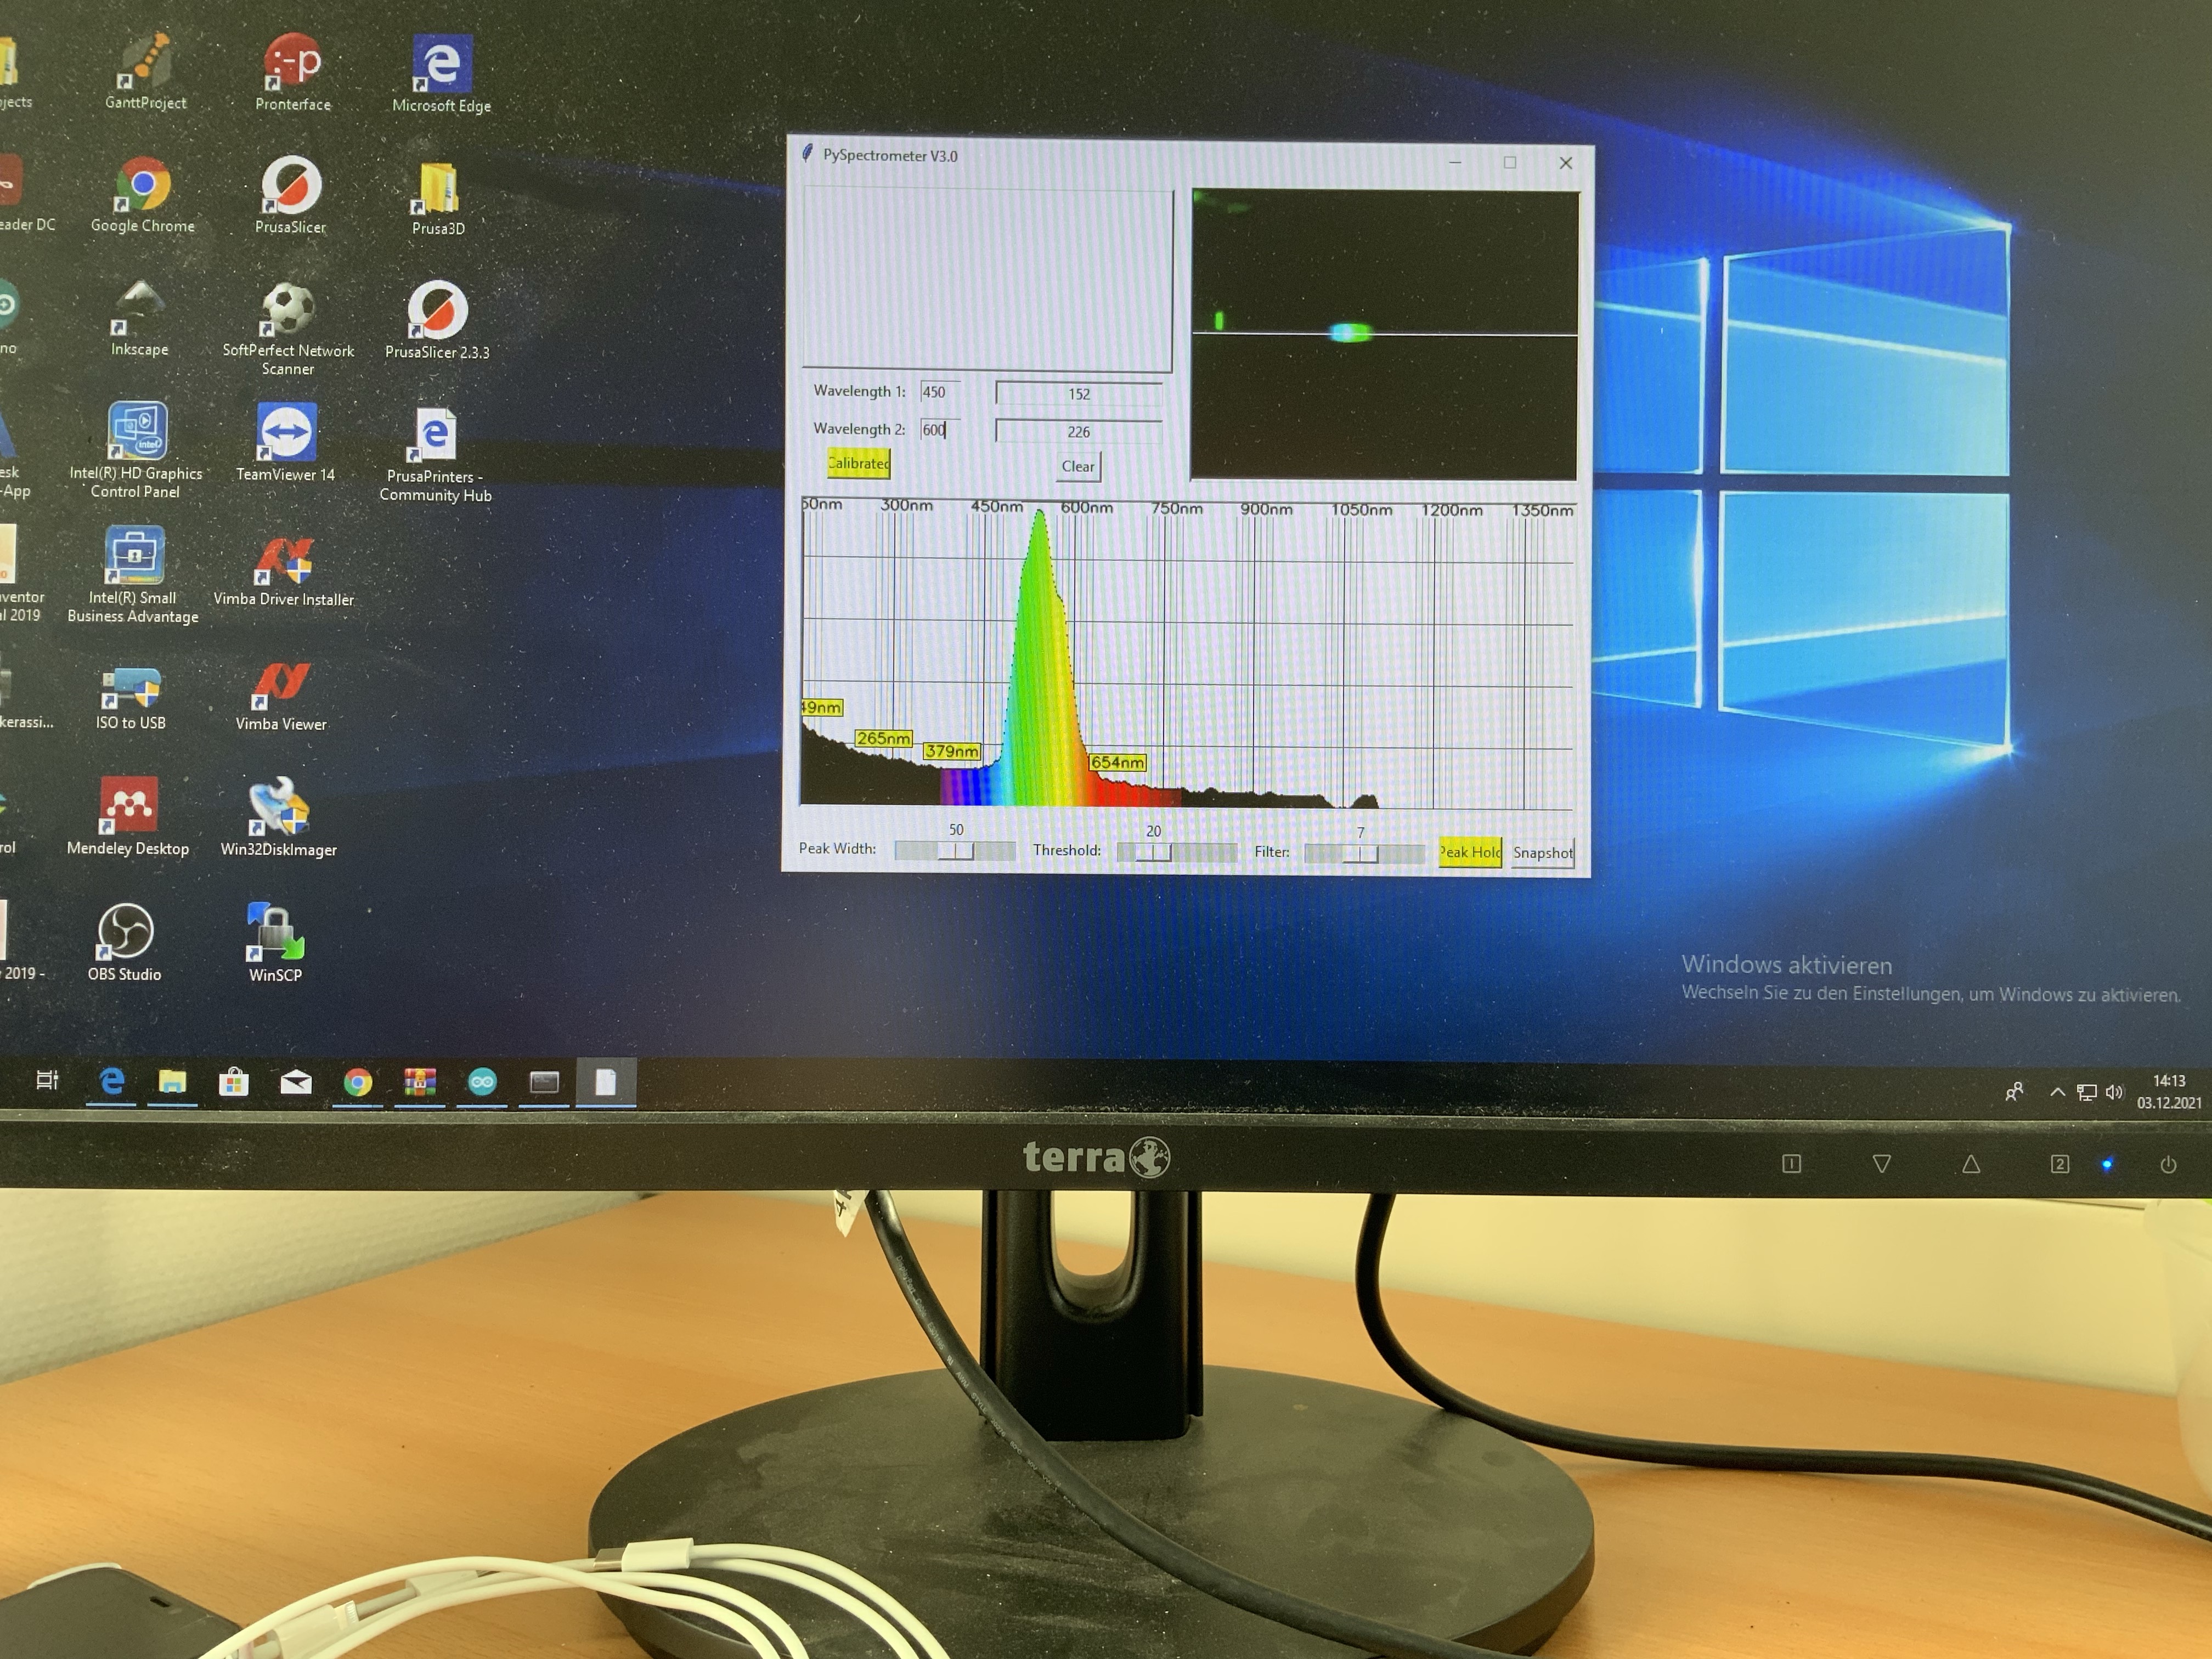 10. Example Plot of a spectrum (green LED)
Further Reading and Resources
For more in-depth information on spectroscopy and related subjects, refer to resources provided by Public Lab and other scientific publications.
Public Lab: https://publiclab.org/wiki/spectrometry
Gaudi Lab: https://www.gaudi.ch/GaudiLabs/?page_id=825
ESPectrometer: https://matchboxscope.github.io/docs/Variants/ESPectrometer
Youtube: https://www.youtube.com/watch?app=desktop&v=T_goVwwxKE4&ab_channel=Les%27Lab
Software: https://github.com/leswright1977/PySpectrometer
Contributing and Collaboration
This open-source project welcomes contributions from everyone. Whether you're experienced in CAD design or programming,
or just starting out, there are many ways to contribute. Check out our CONTRIBUTING guide for more details.
Licensing and Collaboration Notes
This project is licensed under the CERN open hardware license. We encourage users to share their modifications and improvements. All design files are available for free, but we appreciate feedback and collaboration.
For details on the licensing, please visit License.md.
Note: Design files were created using Autodesk Inventor 2019 (EDUCATION).
Stay Connected
If you find this project beneficial, please star this repository, follow us on Twitter, and cite our webpage in your work!